Dapr Ops Dashboard
Automate, monitor, and optimize Dapr across all your Kubernetes clusters with enterprise-grade operational tooling.
What is Diagrid Dapr Ops Dashboard?
Dapr Ops Dashboard is a SaaS solution that automates the operational management of Dapr on Kubernetes. It runs as an agent deployed on your clusters, automating Dapr upgrades and certificate rotation, and providing deep observability into your Dapr workloads to help you run your critical apps confidently from development to production.
🤖Automate Operations
- Dapr installation and upgrades (new releases available within 24 hours)
- Zero-downtime mTLS certificate rotation
- Configuration sync across clusters
- Scheduled upgrades and canary releases to reduce risk
📊Deep Observability
- 150+ metrics across 20+ built-in visualization graphs
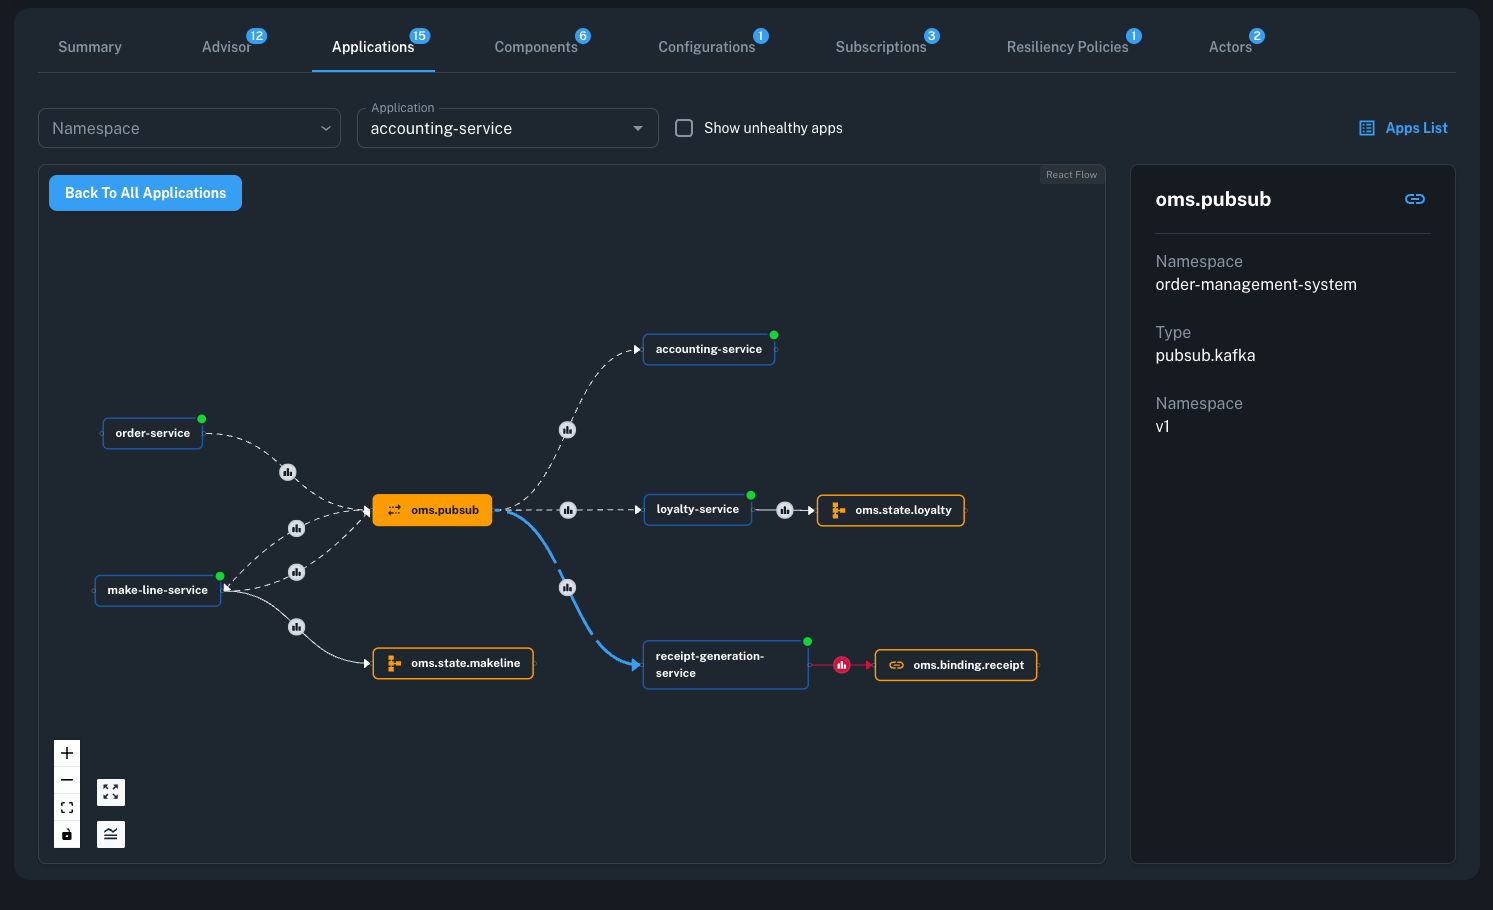
- Dynamic Apps Graph topology showing service invocations and pub/sub dependencies
- Component health and initialization status
- Real-time alerts and diagnostics (reduces incident discovery time by up to 70%)
🔍Built-in Best Practices
- Advisor continuously scans 50+ production best practices
- Security misconfiguration detection
- Resource usage optimization (cost reductions up to 80% in some cases)
- Reliability and performance guidance
Key Benefits
Dapr Ops Dashboard simplifies operating Dapr in production by automating operational tasks, reducing security risks and downtime, and accelerating development through enhanced visibility into the Dapr runtime.
Operational Excellence
Automated upgrades and rollbacks: Dapr Ops Dashboard automates Dapr upgrades and rollbacks, reducing the risk of human error. New Dapr releases are available within 24 hours of their upstream release. For critical fixes, the Dapr Ops Dashboard Enterprise plan offers custom Dapr open-source patches.
Scheduled upgrades & canary releases: Execute certificate rotations and Dapr upgrades immediately or at scheduled times to reduce user impact. Per-application rollout supports canary releases, allowing a subset of applications to test new Dapr sidecars before broader deployment.
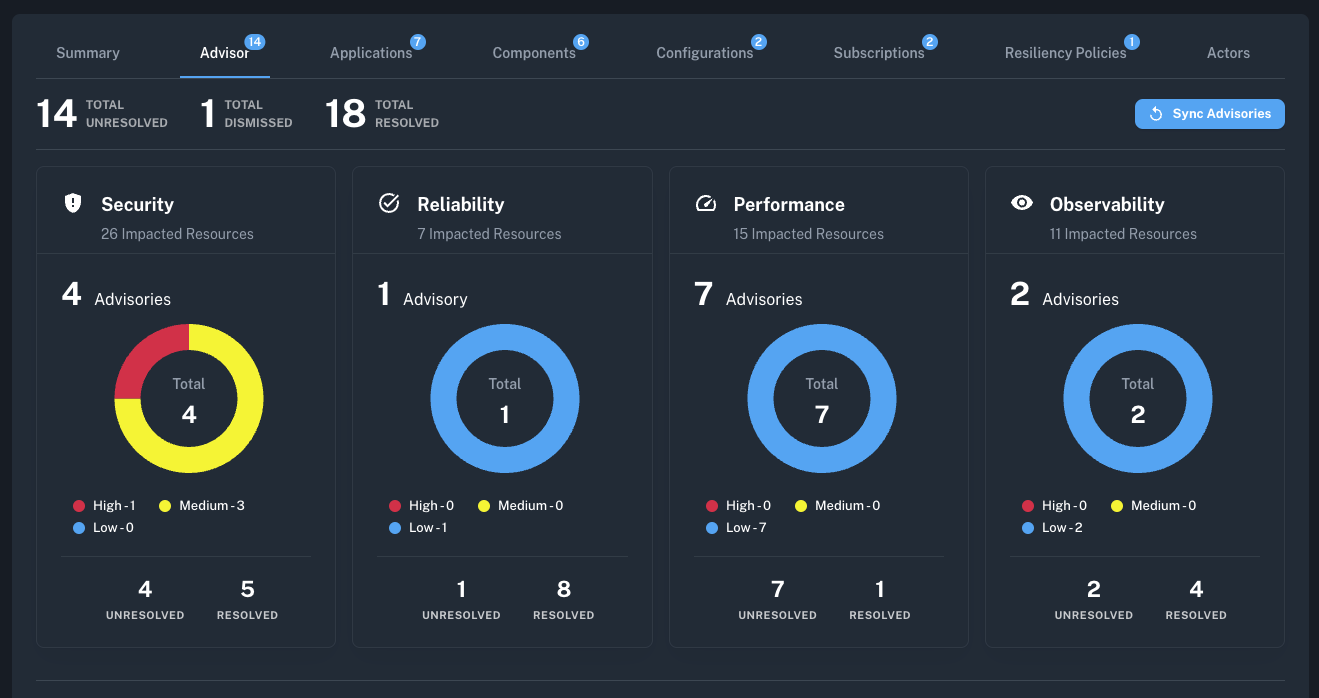
Built-in best practices: Dapr Ops Dashboard's Advisor continuously checks Dapr environments for over 50 production best practices and potential misconfigurations. This continuous monitoring can be integrated directly into build pipelines. Advisor also helps with resource usage optimization—by analyzing historical application usage, Dapr Ops Dashboard suggests optimized resource settings, leading to improved efficiency and cost reductions up to 80% in some cases.
Reduce Security Risks & Downtime
Zero-downtime certificate rotations: Dapr Ops Dashboard automates mTLS certificate rotation across the control plane and all workloads at your preferred frequency and time window, maintaining secure communication with an up-to-date trust chain.
Critical alerts: Dapr Ops Dashboard includes built-in checks and dozens of alerts for misconfigurations and errors, promptly notifying you of unexpected events. Component initialization checks detect infrastructure misconfigurations immediately after deployment without examining sidecar logs. Metrics can be exported to Grafana dashboards, or alerts can be sent via email or integrated with monitoring systems via webhooks.
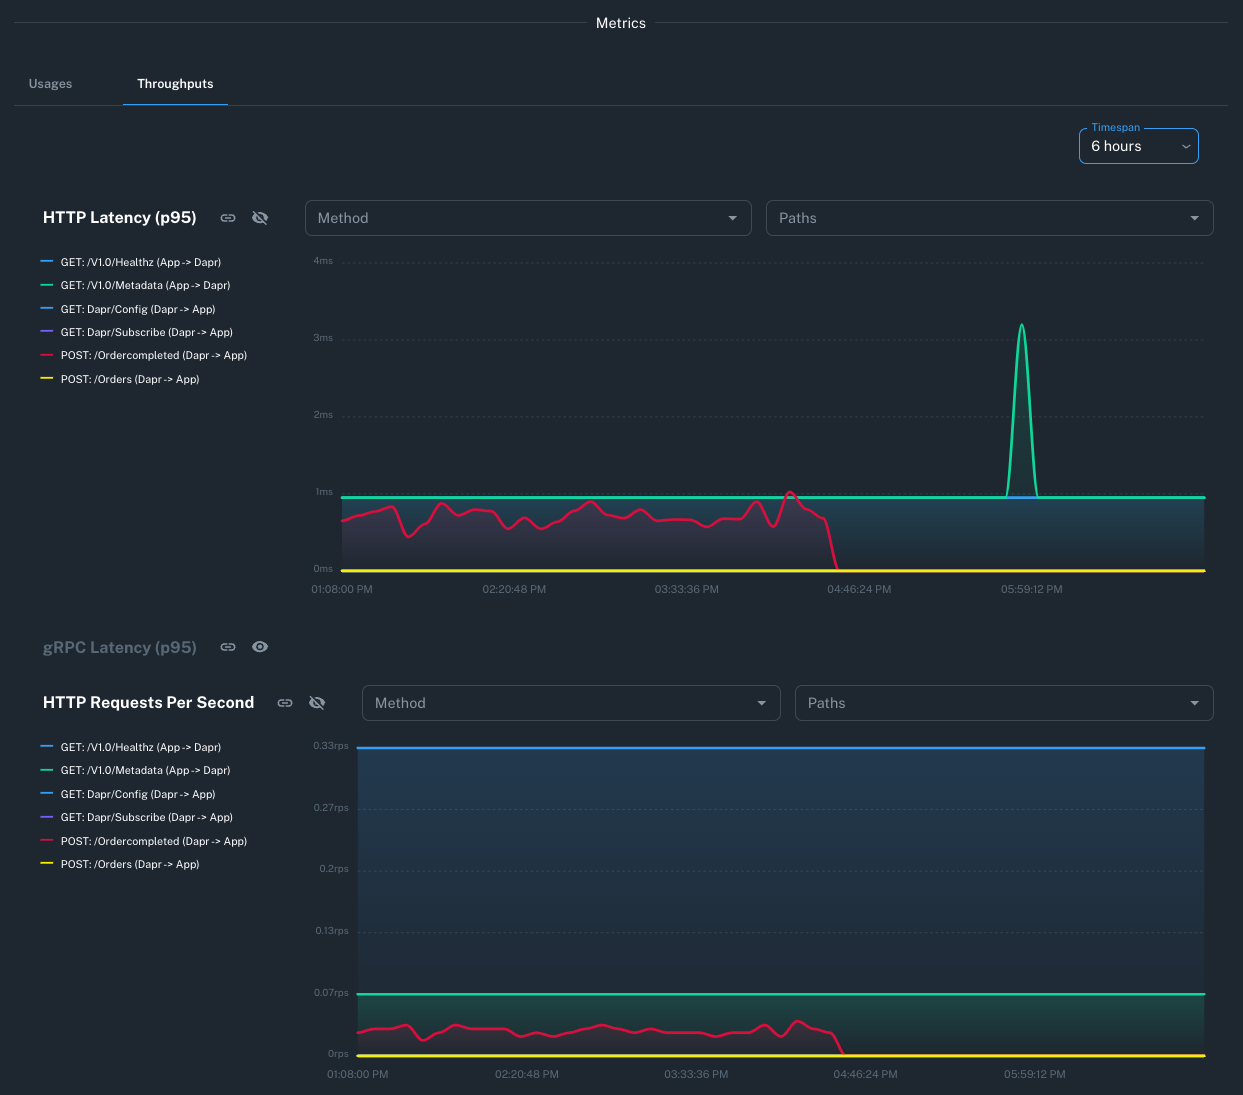
Visualize golden metrics: Dapr Ops Dashboard's metrics graphs enable precise identification and resolution of issues during troubleshooting. By capturing over 150 Dapr metrics across 20+ visualization graphs, you can identify resource usage issues, network errors, and slow responses. These metrics can be exported and visualized in existing observability tools.
Develop & Troubleshoot Faster
Dynamic application topology: Dapr Ops Dashboard's Apps Graph maps out your system topology using real-time metrics without the need for tracing integration. It shows how applications interconnect through synchronous service invocations or asynchronous pub/sub interactions, and what infrastructure components they depend on.
Dapr runtime insights: Dapr Ops Dashboard provides unified visibility into the Dapr runtime, offering detailed insights that generic monitoring tools cannot match:
- Actors: Deep understanding of Dapr Actor behavior by displaying active instances, actor types, and recent actor placement information
- Resiliency policies: Visibility into resiliency policy configurations, the applications using them, and their usage rates to understand system health and behavior
- Pub/Sub subscriptions: Unified visibility into all subscription types (declarative, programmatic, and streaming), allowing teams to monitor subscriptions without switching between tools or digging into source code
Get Started
Feature Deep-dive
Configuration & Management
Operational Excellence
Installation Methods
Choose the Dapr Ops Dashboard installation method that fits your workflow and environment.
🖥️Console (Recommended)
⌨️Diagrid CLI
📦Helm (Enterprise)
How-To Guides
Organization & Security
👥User Management
🔐SSO Authentication
🔑API Keys
🛡️Security & Data
Learn Core Concepts
What problems does Dapr Ops Dashboard solve?
Running Dapr in production requires:
- Regular upgrades to get security patches and new features
- Certificate management for mTLS trust chains
- Monitoring across control plane and application sidecars
- Best practices enforcement for security and reliability
- Troubleshooting when things go wrong
Dapr Ops Dashboard automates all of this, reducing operational burden by up to 70% and incident discovery time significantly.
How does Dapr Ops Dashboard work?
- Install lightweight agent in your Kubernetes cluster (
diagrid-cloudnamespace) - Agent connects outbound to Diagrid Cloud (no inbound traffic required)
- Dapr Ops Dashboard manages Dapr control plane based on your configuration
- Metrics and logs flow to the Dapr Ops Dashboard console for monitoring
- You manage everything from the Dapr Ops Dashboard console or CLI
The agent requires minimal resources and only needs outbound HTTPS access.
What data does Dapr Ops Dashboard collect?
Dapr Ops Dashboard collects only operational data:
- ✅ Dapr control plane metrics and health
- ✅ Dapr sidecar logs and metrics (not your app logs)
- ✅ Cluster configuration and Kubernetes metadata
- ❌ No application data or business logic
- ❌ No sensitive secrets or credentials
All data is encrypted in transit and at rest.
Can I use Dapr Ops Dashboard with existing Dapr installations?
Yes! Dapr Ops Dashboard can:
- Monitor existing Dapr installations without changes
- Optionally take over management for upgrades and configuration
- Coexist with your current deployment workflows
- Be removed cleanly if needed (just delete the namespace)
Does Dapr Ops Dashboard support multi-cloud and on-premises?
Yes! Dapr Ops Dashboard works with:
- ☁️ Managed Kubernetes: EKS, AKS, GKE, and others
- 🏢 On-premises: OpenShift, Rancher, vanilla Kubernetes
- 💻 Local development: Kind, Minikube, Docker Desktop
- 🌐 Multi-cloud: Connect clusters from different providers to one organization
Only requirement: outbound HTTPS access to cloudgrid.diagrid.io
Next Steps
Quick Start
Get up and running in 10 minutes
Watch Demo
See Dapr Ops Dashboard in action
Start Free
Connect a cluster on the Free plan
Join our community or contact sales for enterprise support.
