Apps Graph
The App Graph page in the Catalyst console shows the live call topology across every App ID in your project — app-to-app, agent-to-agent, app-to-tool, and every call into backing infrastructure (components and managed services).
What the graph shows
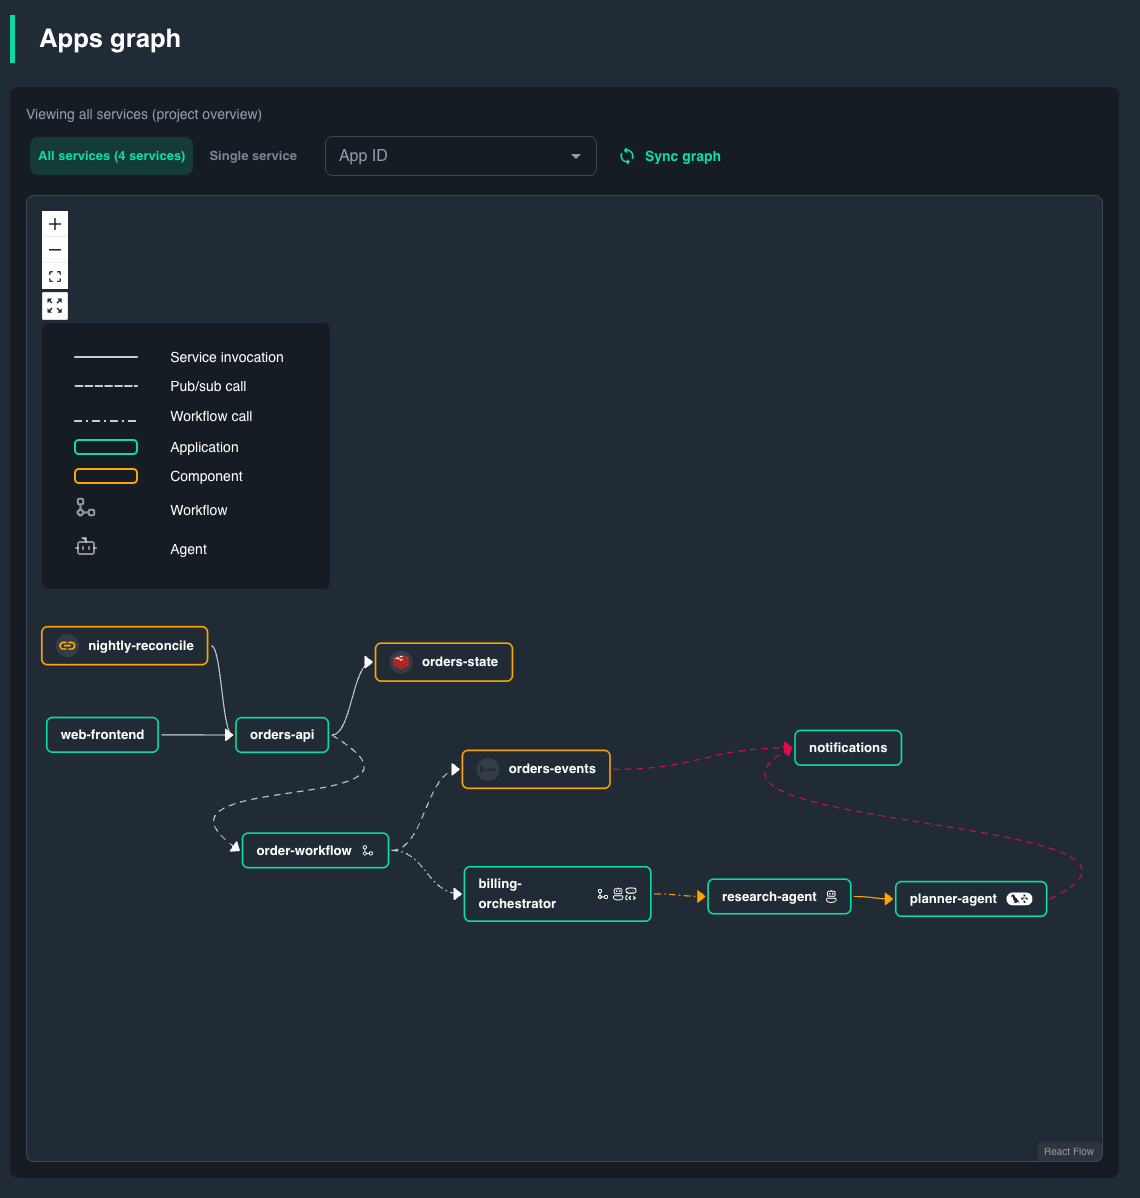
Node and edge types are discovered from Dapr runtime metrics — no manual configuration is needed.
- Nodes are App IDs. Tags on a node show which agent frameworks are running (Dapr Agents, LangGraph, CrewAI, etc.), active workflows, and connected components or managed services.
- Edges point from caller to callee. Hover or click an edge to see its metrics.
- Edges turn red when the error rate is above zero.
Live metrics on edges
When you hover or select an edge, the graph displays real-time metrics for the current time window:
- RPS — Requests per second flowing through the edge.
- P95 latency — 95th percentile response time.
- Error rate — Percentage of calls that returned an error.
These metrics update on a 1-minute polling interval. The graph only shows live traffic. For history or longer time ranges, use the Metrics page.
Navigating the graph
- Select a node to highlight its inbound and outbound connections and see a breakdown of call volume, error rate, and a link to API Logs filtered to that App ID.
- Select an edge to inspect the specific call path, including topic name (for pub/sub) or workflow type.
- Zoom and pan to explore large topologies. The layout auto-arranges nodes using a hierarchical algorithm.
Agent and workflow visibility
Catalyst enriches the graph with runtime intelligence from the data plane:
- Agent detection — App IDs running frameworks like Dapr Agents, LangGraph, CrewAI, or others are automatically tagged. The graph displays which agent frameworks are active on each node.
- Workflow detection — App IDs with active workflow definitions show which workflows are running, and workflow-type edges reveal the orchestration paths between services.
This means the app graph doubles as an agent topology map: you can trace how a multi-agent system coordinates — which agent calls which tool, which agent delegates to another, and where failures occur in the chain.
When the graph is empty
The graph requires traffic between App IDs to build the topology. If you see "graph not updated yet":
- Ensure at least one App ID exists in the project.
- Generate some traffic (e.g., invoke a service, publish a message, or trigger a workflow).
- Allow some time for the graph to populate.
The graph is computed by a background job that aggregates metrics from the data plane. On first access, there may be a brief delay while the job initializes.
Use cases
Tracing a request end-to-end
Obtain insights on how traffic flows through multiple services, agents, or components:
- Find the App ID that receives the request first.
- Follow its outbound edges to the next hop.
- Click each edge along the path to see its RPS, P95 latency, and error rate.
- If a hop looks slow or failing, click the node to open API Logs for that App ID and look at the actual requests.
Debugging multi-agent systems
When an agent chain fails or produces unexpected results:
- Open the App Graph to see the full agent-to-agent call topology.
- Look for edges with elevated error rates (highlighted in red).
- Click the failing edge to jump to API Logs for that specific call path.
- Correlate with the Agents page to inspect individual agent executions.
Discovering unexpected dependencies
The graph reveals call paths that may not be obvious from code alone — for example, a pub/sub subscriber you forgot about, or an agent that invokes a tool you didn't expect. Use this to audit your topology before making breaking changes.
Capacity planning
High-RPS edges indicate hot paths. Combine the graph view with the Metrics page to identify services that need scaling or optimization.
Related pages
- Agents — Inspect individual agent executions, sessions, and tool calls.
- Metrics — Detailed per-App ID metrics (CPU, memory, request volume).
- API Logs — Request-level logs for each Dapr API call.
- Observability — Configure tracing backends and sampling rates.
- Observability concepts: the concepts behind metrics, logs, traces, and the application graph.