Applications
In addition to providing cluster-level observability and management operations, Conductor allows you to drill into individual Dapr-enabled applications running within a cluster to gain deeper visibility into application health and performance.
An application in Conductor represents a Kubernetes pod (or set of pods) with the Dapr sidecar injected.
Application Insights
Each Dapr-enabled application within a cluster can be monitored using the App Summary dashboard, which provides granular details about the application including:
- Pod and container health
- Critical logs issues, critical metrics issues, and high-impact advisories
- Resource usage metrics
- Dapr API usage and latency
Pod and Container Health
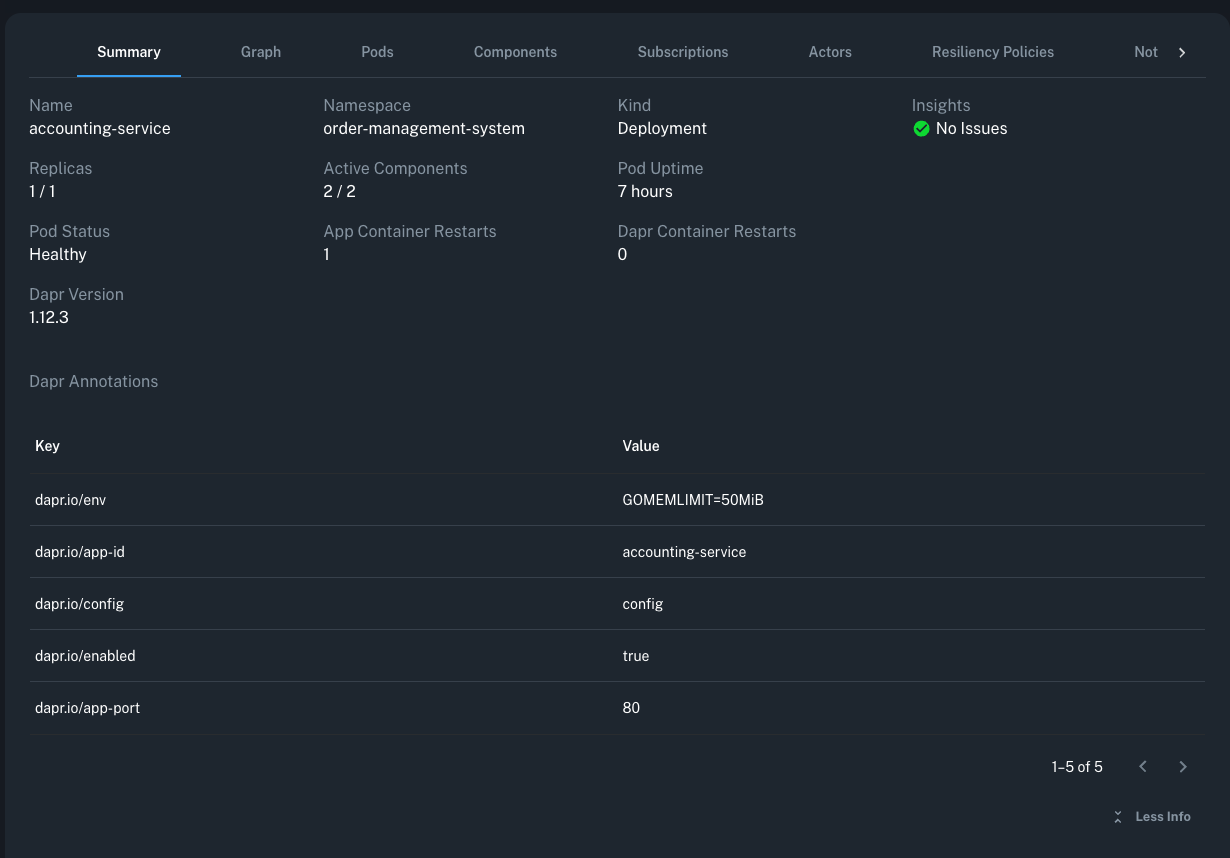
To ensure operators that an application is up-and-running as expected on the cluster, traditional Kubernetes pod lifecycle data is presented in the App Summary view including:
- Pod Status:
Healthyif both the app and the Dapr sidecar container health checks pass successfully - Container Restarts: How many times a container within the pod has been restarted (Dapr sidecar or Application)
- Pod Uptime: How long the current pod has been running successfully since the last restart
To dive deeper into pod and container data for the application, navigate to the Pods tab, which provides more detailed information regarding all pod replicas currently running in the cluster.

The app summary also provides helpful Dapr sidecar insights such as the sidecar Dapr version, the number of active Dapr components (used in last 10 minutes), and the Kubernetes deployment annotations used for Dapr configuration purposes.
Critical Issues and High-Impact Advisories
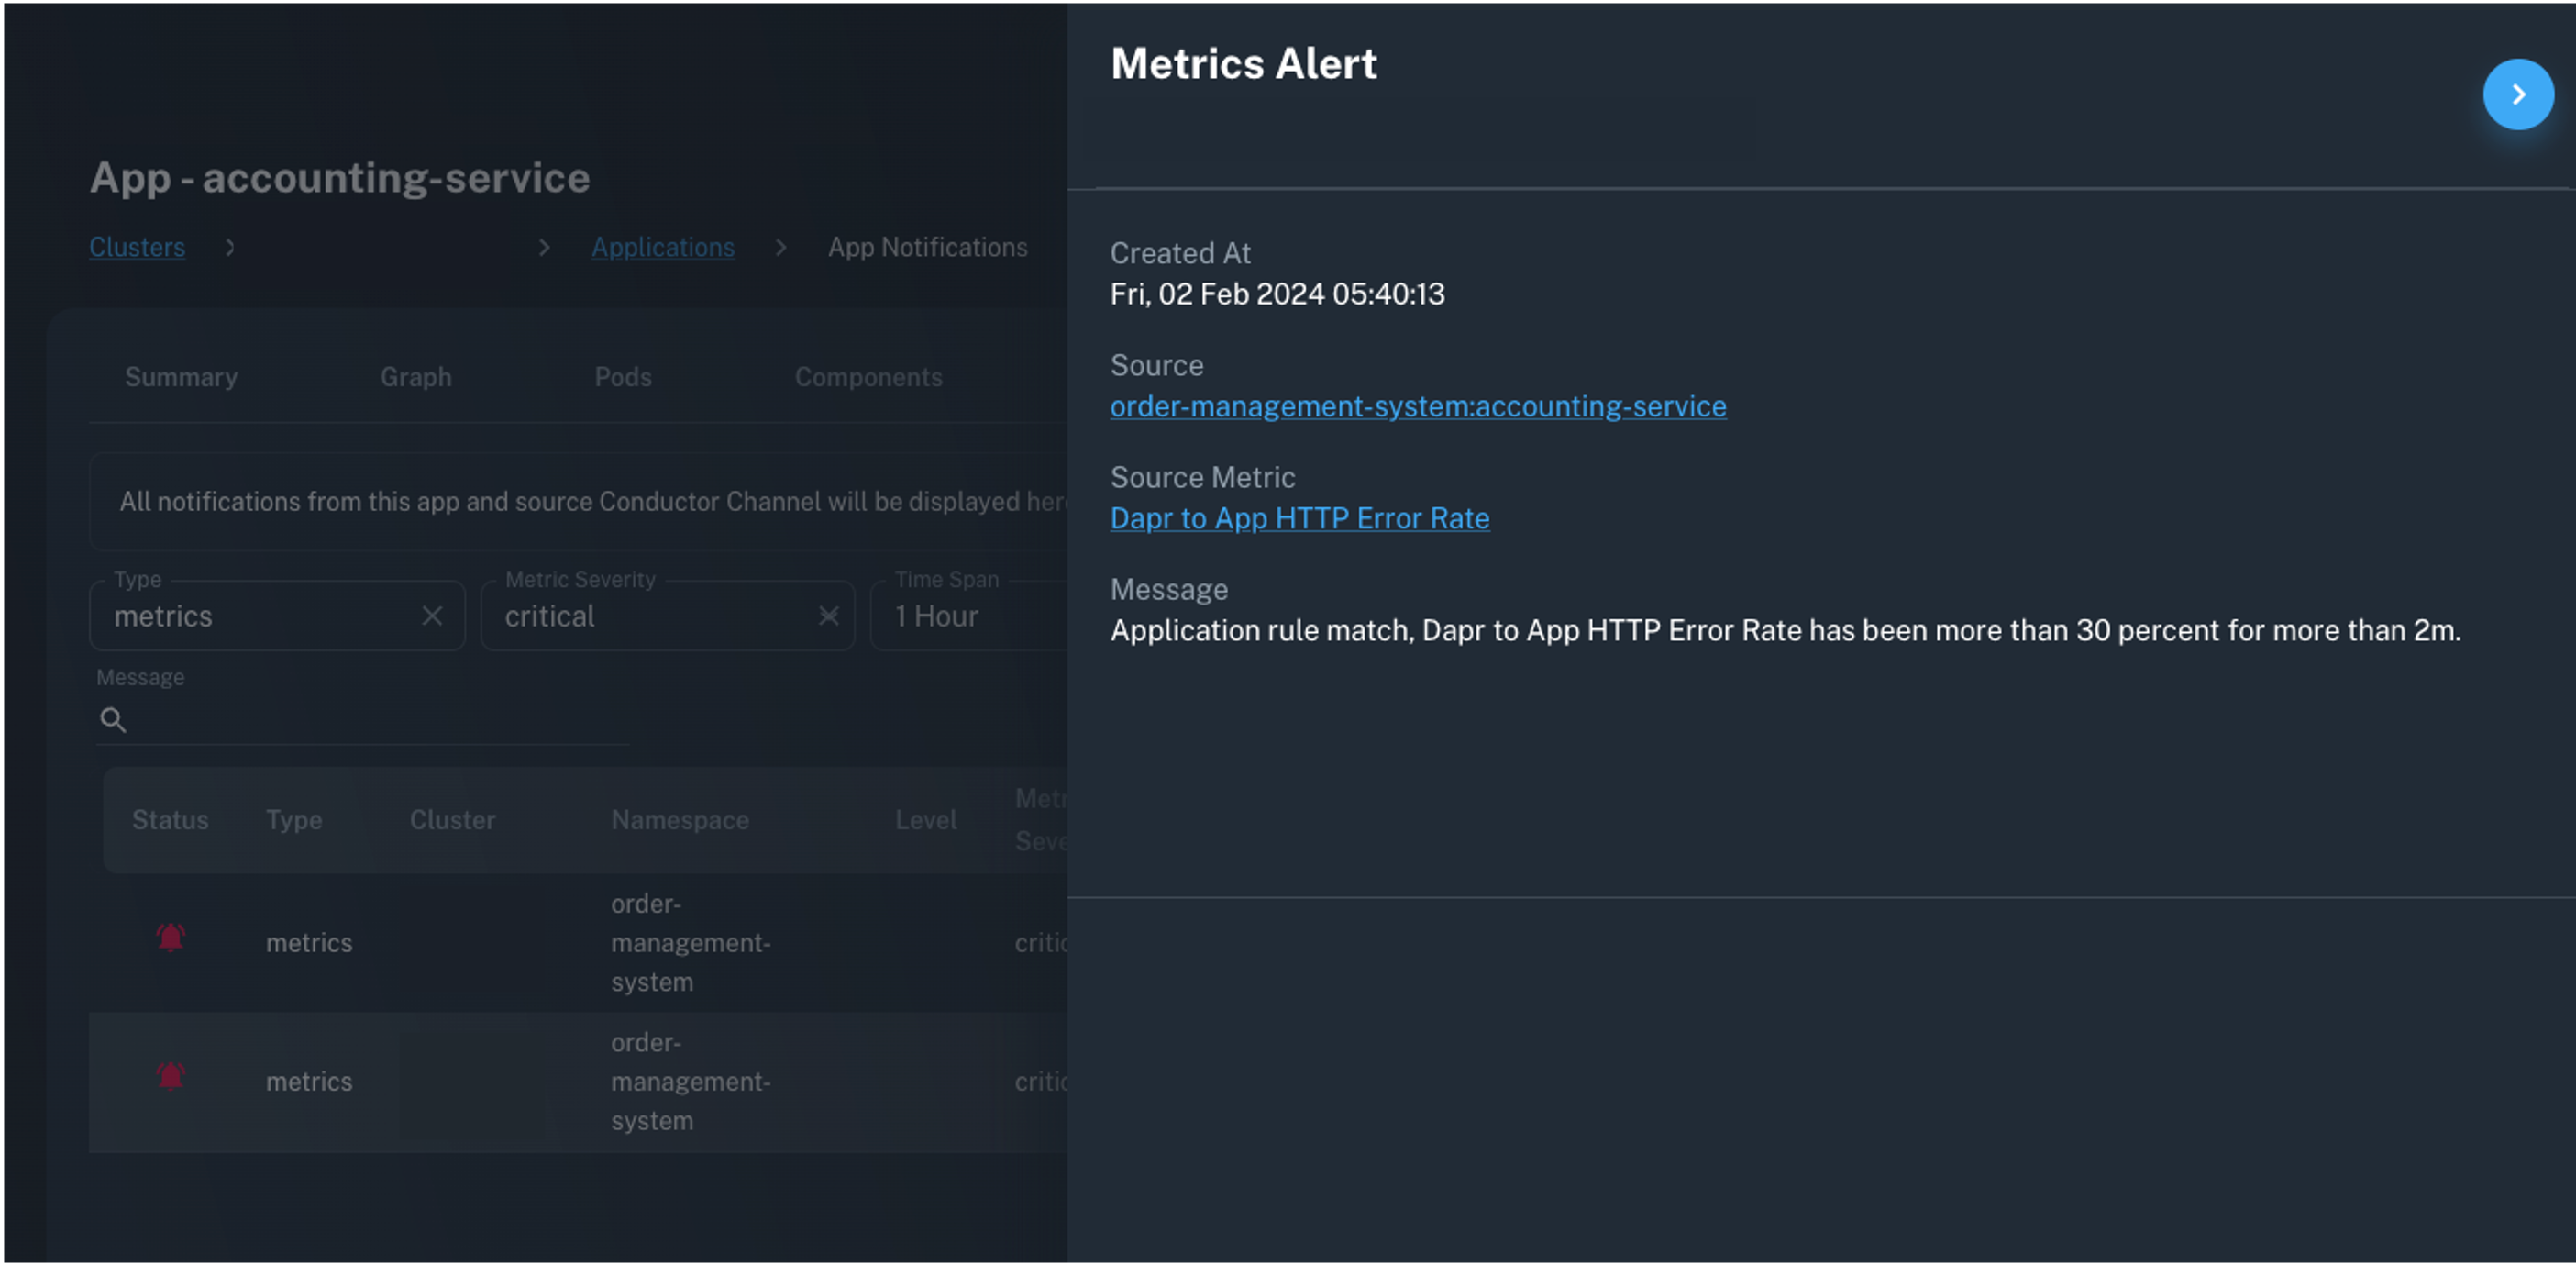
Within the application summary, Insights serves as an aggregated indicator of any critical app metrics or logs notifications thrown in the past hour along with the presence of any application-specific high-impact advisories.
These insights are linked directly to the source notifications in the Conductor events view so operators can easily uncover the current issues impacting the application.
For example, here you can see an application view which shows one critical metrics issue has been fired in the past hour:

Upon selecting the metrics issue, further details related to the metrics issue can be viewed:
Resource Usage Metrics
Resource Management
If an application has resource requests and limits set, Conductor provides a visualization to display the average CPU and memory usage of a pod replica relative to the application requests and limits defined in Kubernetes.

Usage Metrics
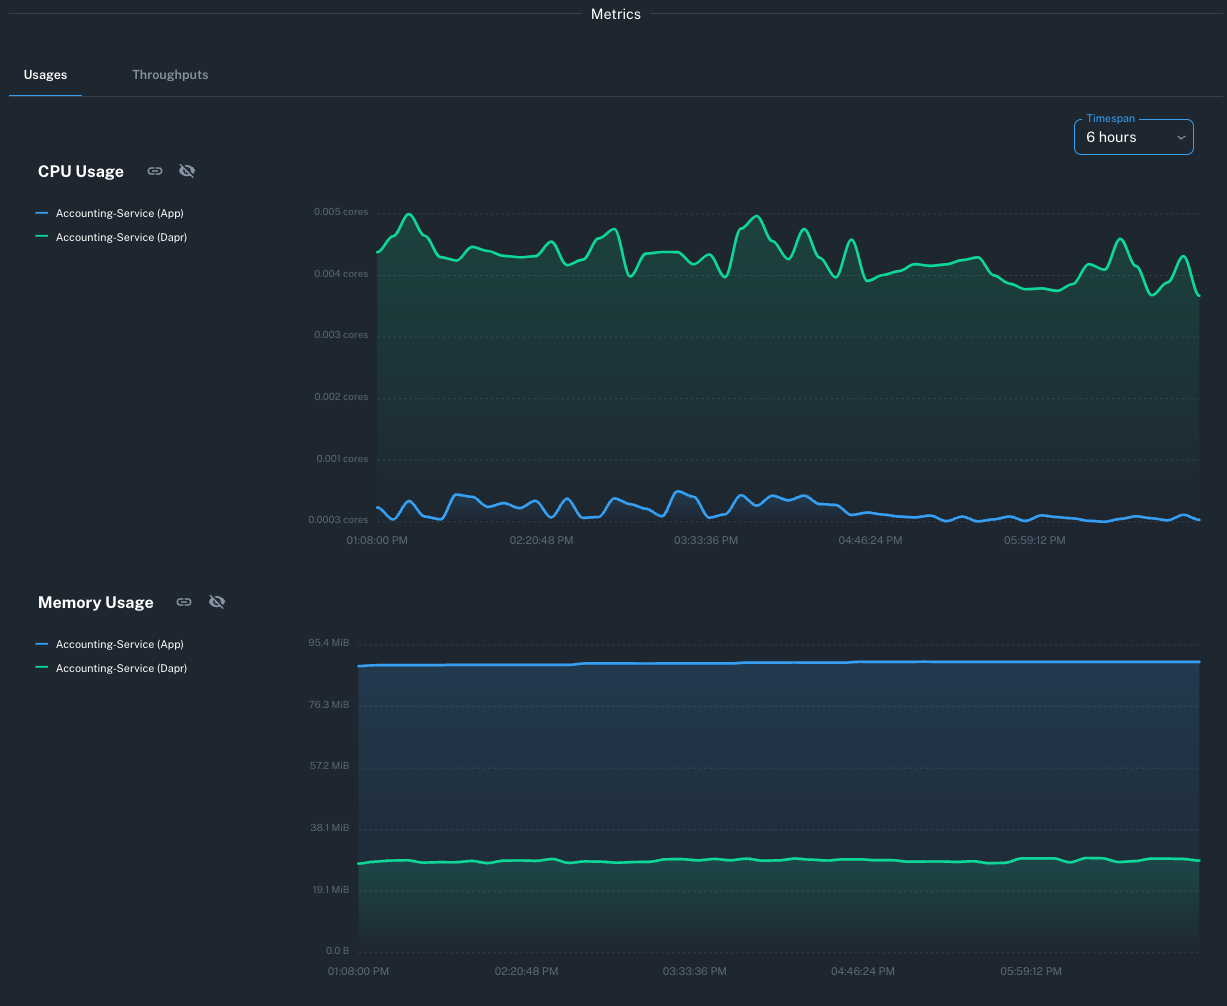
To dive deeper into pod CPU and memory usage by container, including the application container and Dapr sidecar, use the Conductor Usages graphs. These graphs support visualizing CPU and memory for a timespan of up to seven days.
Dapr API Usage and Latency
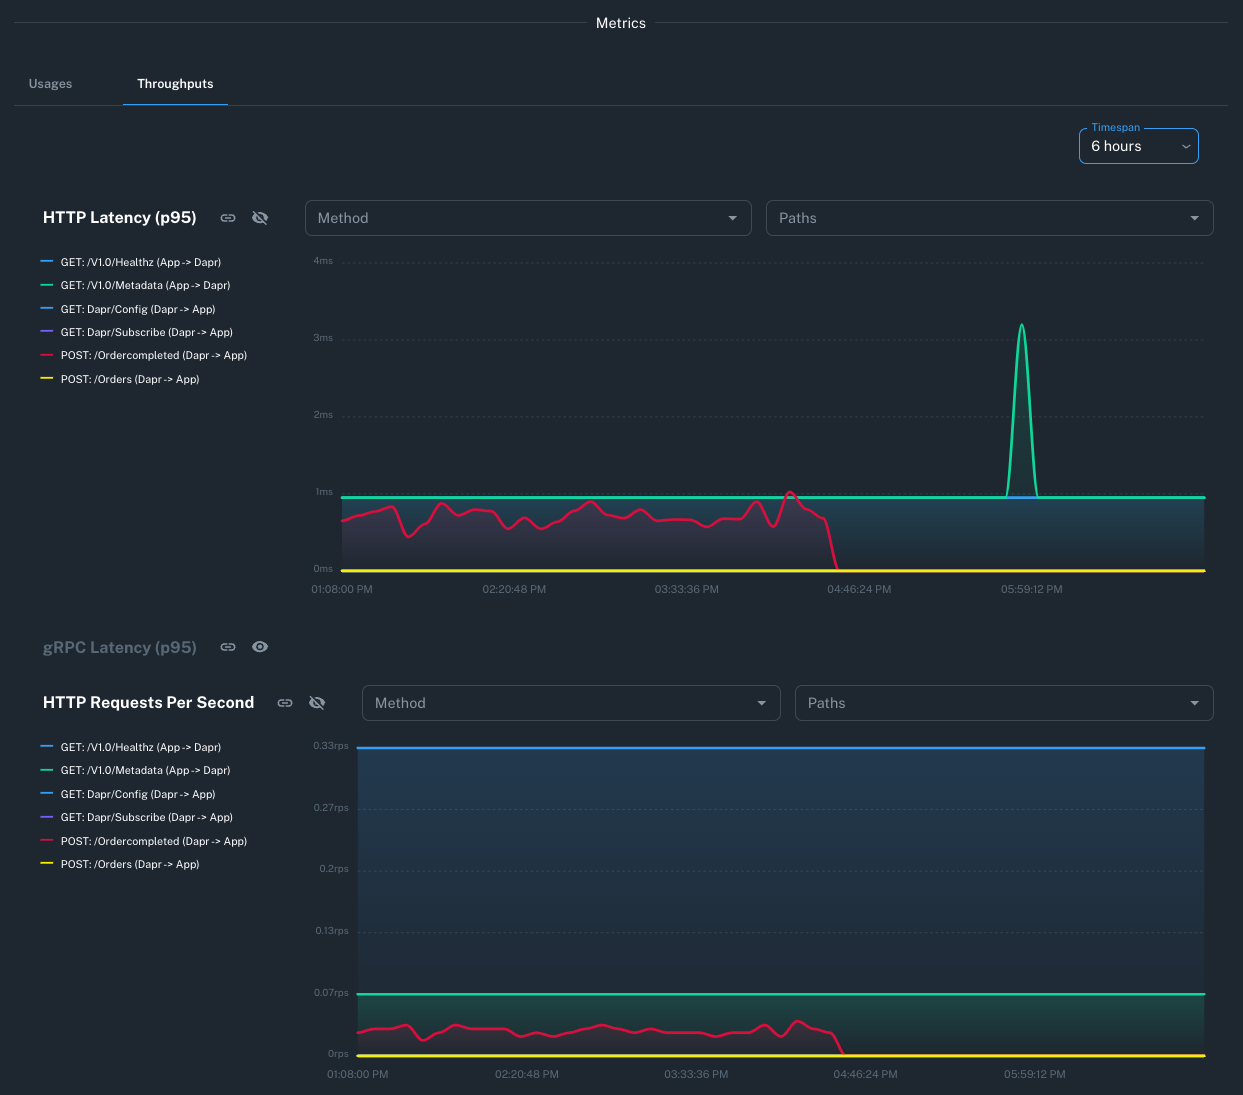
Conductor provides critical data on how Dapr and an application workload are interacting over gRPC and HTTP to enable operators to monitor Dapr API throughputs.
Dapr API interaction data is shown for requests to the sidecar from the application container (App -> Dapr), as well as outgoing requests which are requests from the sidecar container to the application (Dapr -> App).
The following Throughputs graphs are provided:
- HTTP and gRPC Requests Per Second
- HTTP and gRPC Request Error Rate
- HTTP and gRPC Latency - 95th percentile (Enterprise-only)
Application Visualization
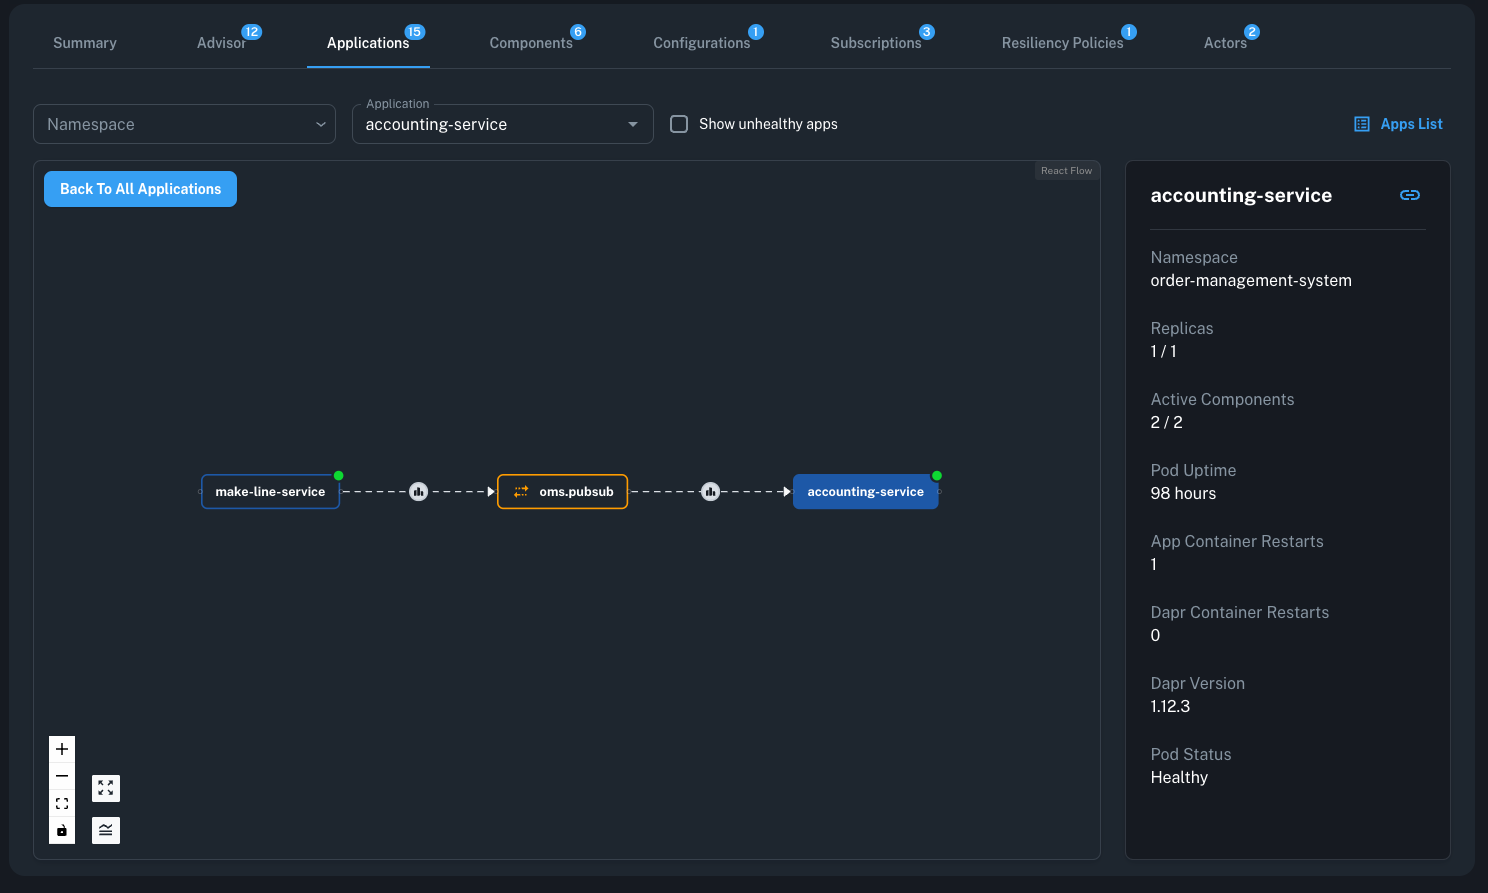
The Apps Graph is available in the context of a single application in Isolated state, providing a visual representation of the application's interactions with components and other applications in the cluster. For detailed information about using the Apps Graph, including isolated view features and interactions, see Apps Graph.
Scoped Resource Insights
Dapr resources which include the application in the scopes section are shown at the application level to provide an easy view of all relevant and connected resources.
Components
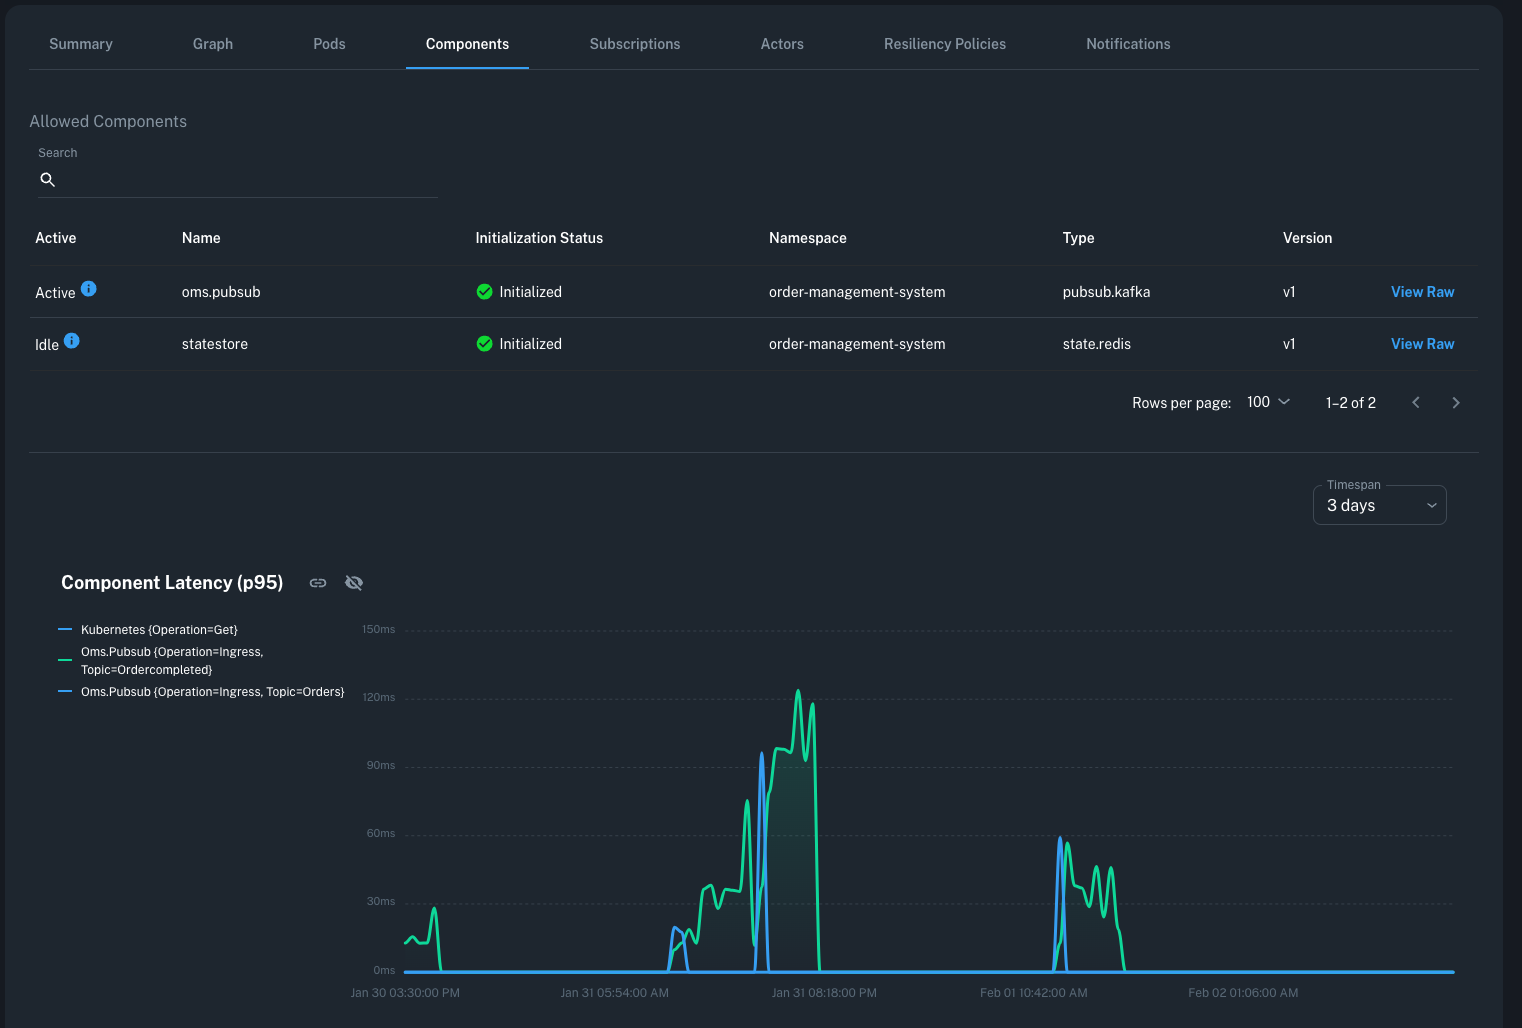
All components which are scoped to an application can be viewed with more context by navigating to a specific application and selecting the Components tab. For each component, there is an active status which indicates if the component has been used by the application at any point in the past five minutes.
There are also graphs to provide more insights into Components metrics over time related to requests per second, error rates, and latency (Enterprise-only).
Subscriptions
All Dapr subscription resources accessible to the application via scopes can be listed and viewed by navigating to the Subscriptions tab in the console.
Actors
All actor instances scoped to the selected application are shown on the Actors tab along with the same actor metrics graphs shown at the cluster level.
Resiliency Policies
In addition to seeing the list of resiliency policies which include the selected app in the scopes section, you can also view metrics at the application level indicating the rate at which the invoke count of the policy is changing over time.