Clusters
This document details the various insights in Conductor which provide visibility into the overall health of onboarded Dapr Kubernetes clusters. For information on managing cluster connections in Conductor, please see the cluster configuration overview.
To ensure operators can easily assess the state of a Dapr cluster, Conductor provides an all-in-one dashboard which displays critical information pertaining to the Dapr control plane and data plane on a per-cluster basis. Conductor also provides additional cluster insights which are detailed in this document.
Cluster Insights
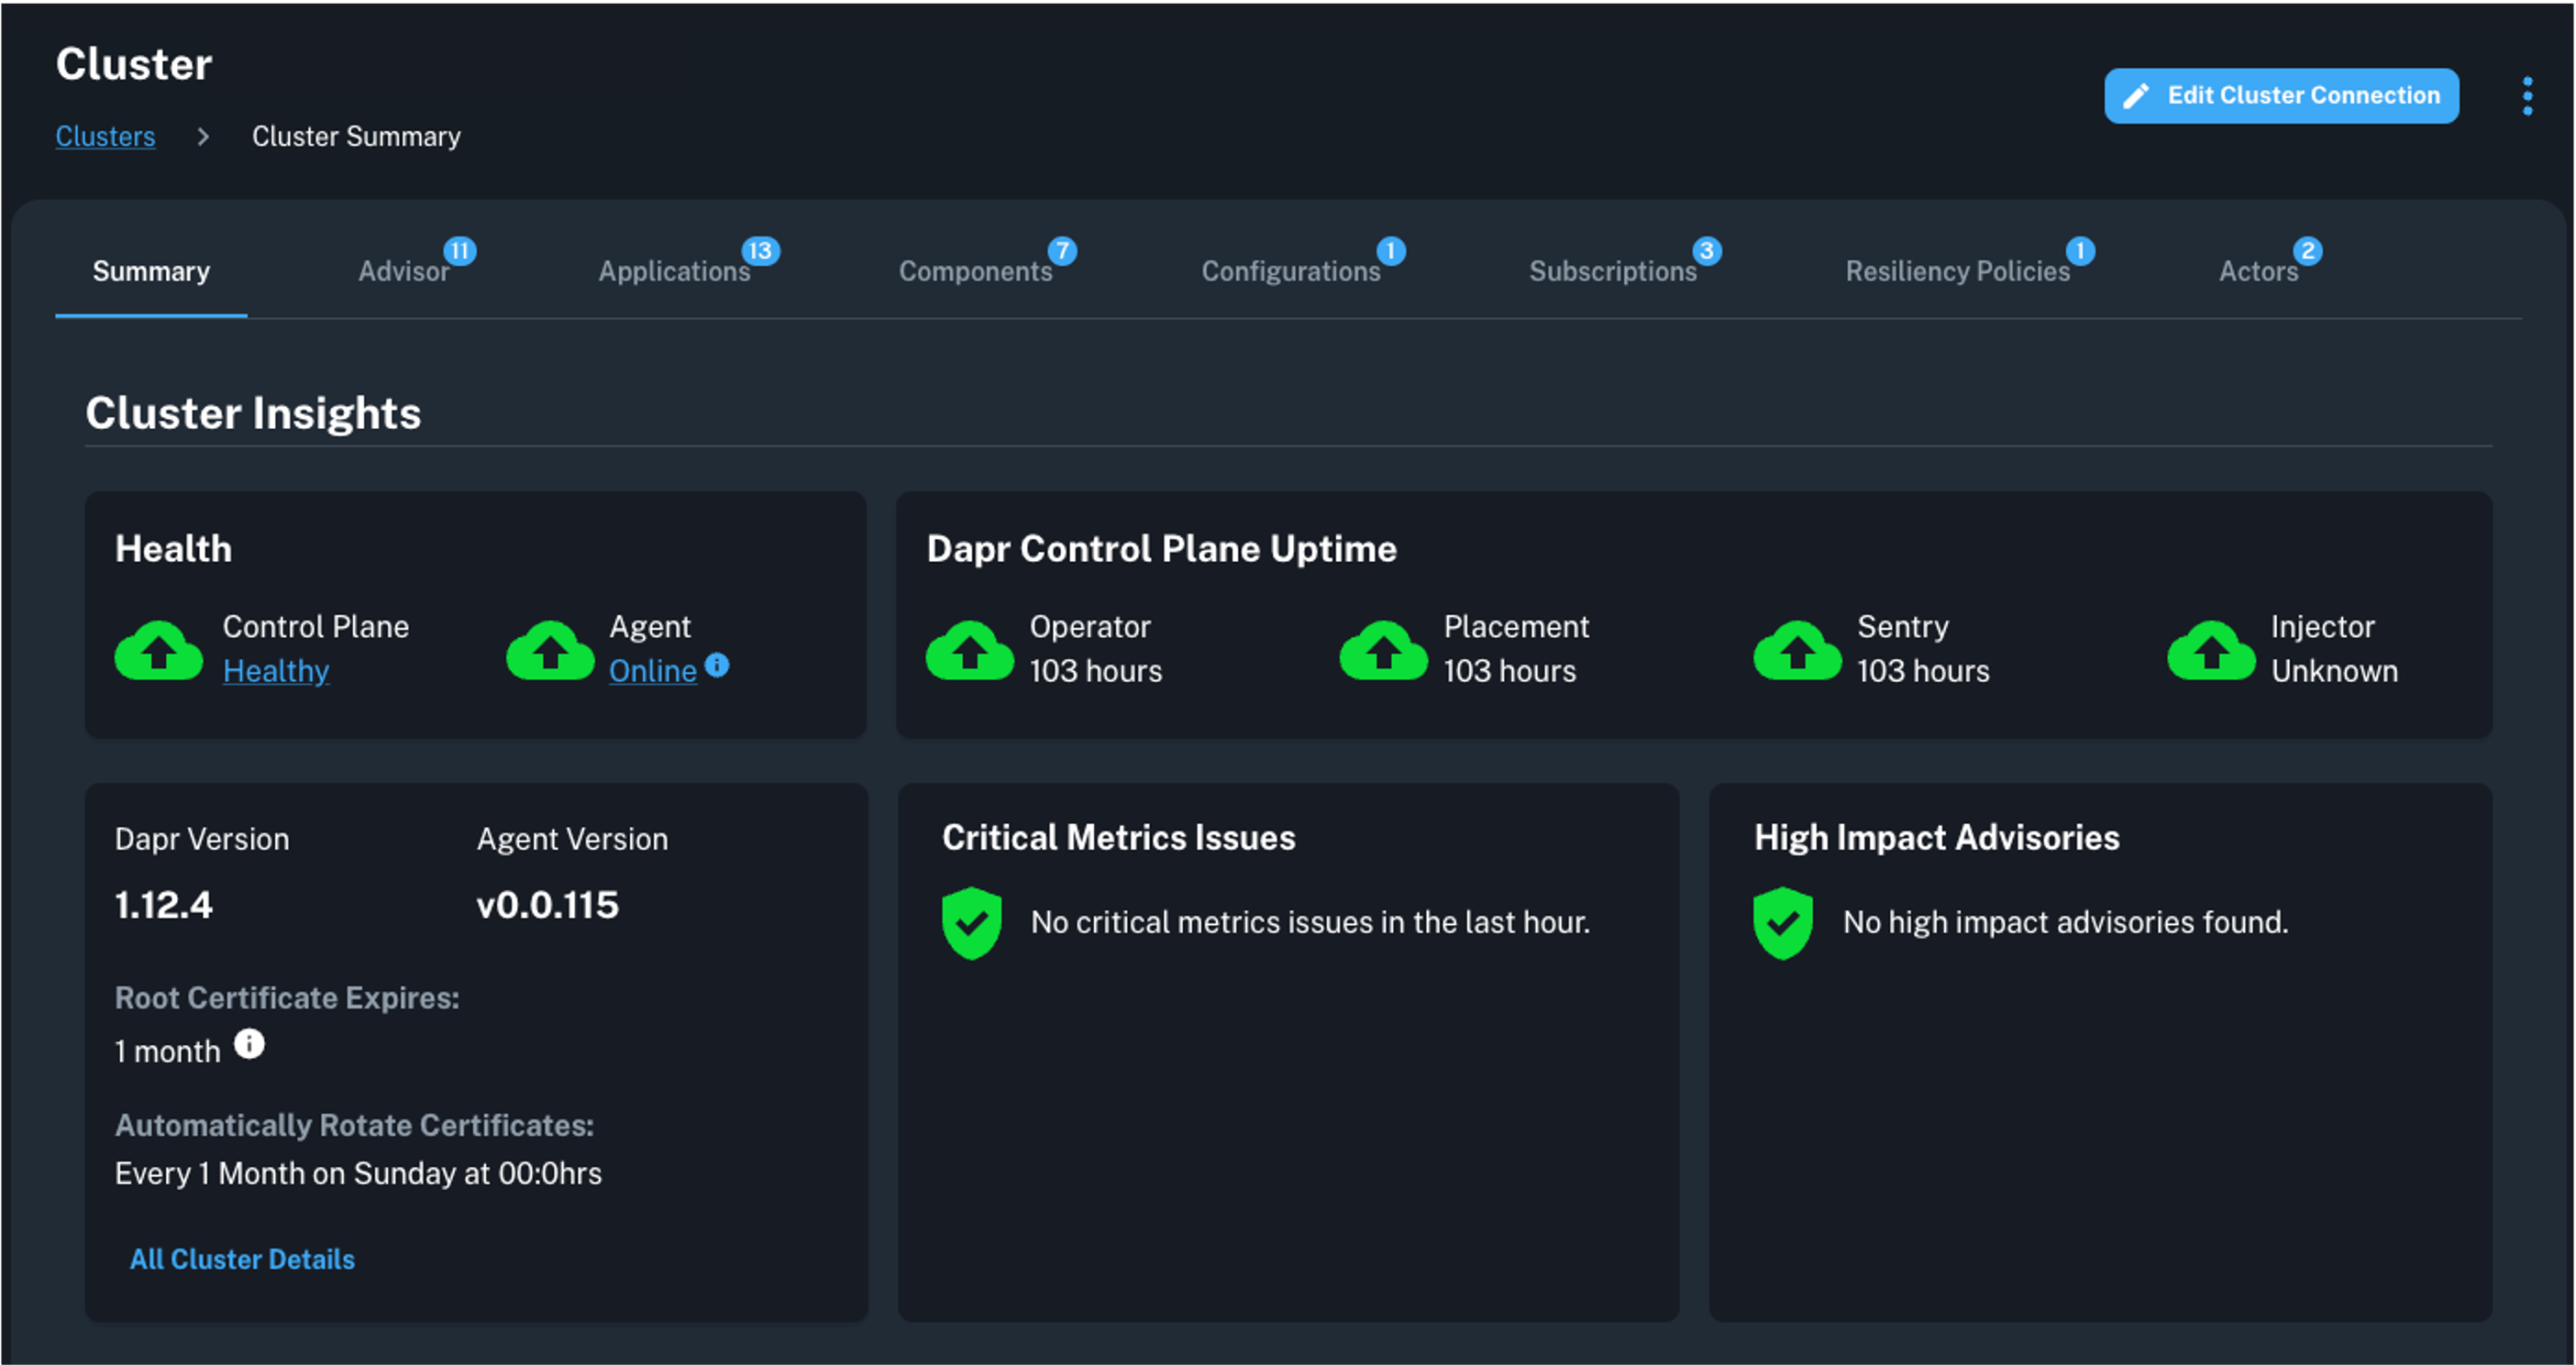
The cluster insights view provides easy visibility into the following:
- Cluster control plane health and uptime
- Conductor agent status logs
- Critical Dapr control plane metrics issues
- Proactive recommendations for optimizing Dapr operations within the cluster via Advisor
Dapr Control Plane Health
Ideally, the Dapr control plane in the cluster is always healthy, however this may not be the case. To explore the data driving the Control Plane health status, select the Healthy or Unhealthy indicator under control plane health.
The control plane health view shows each Dapr control plane pod along with data which can be used to hone in on potential issues such as pod restart count and status message.
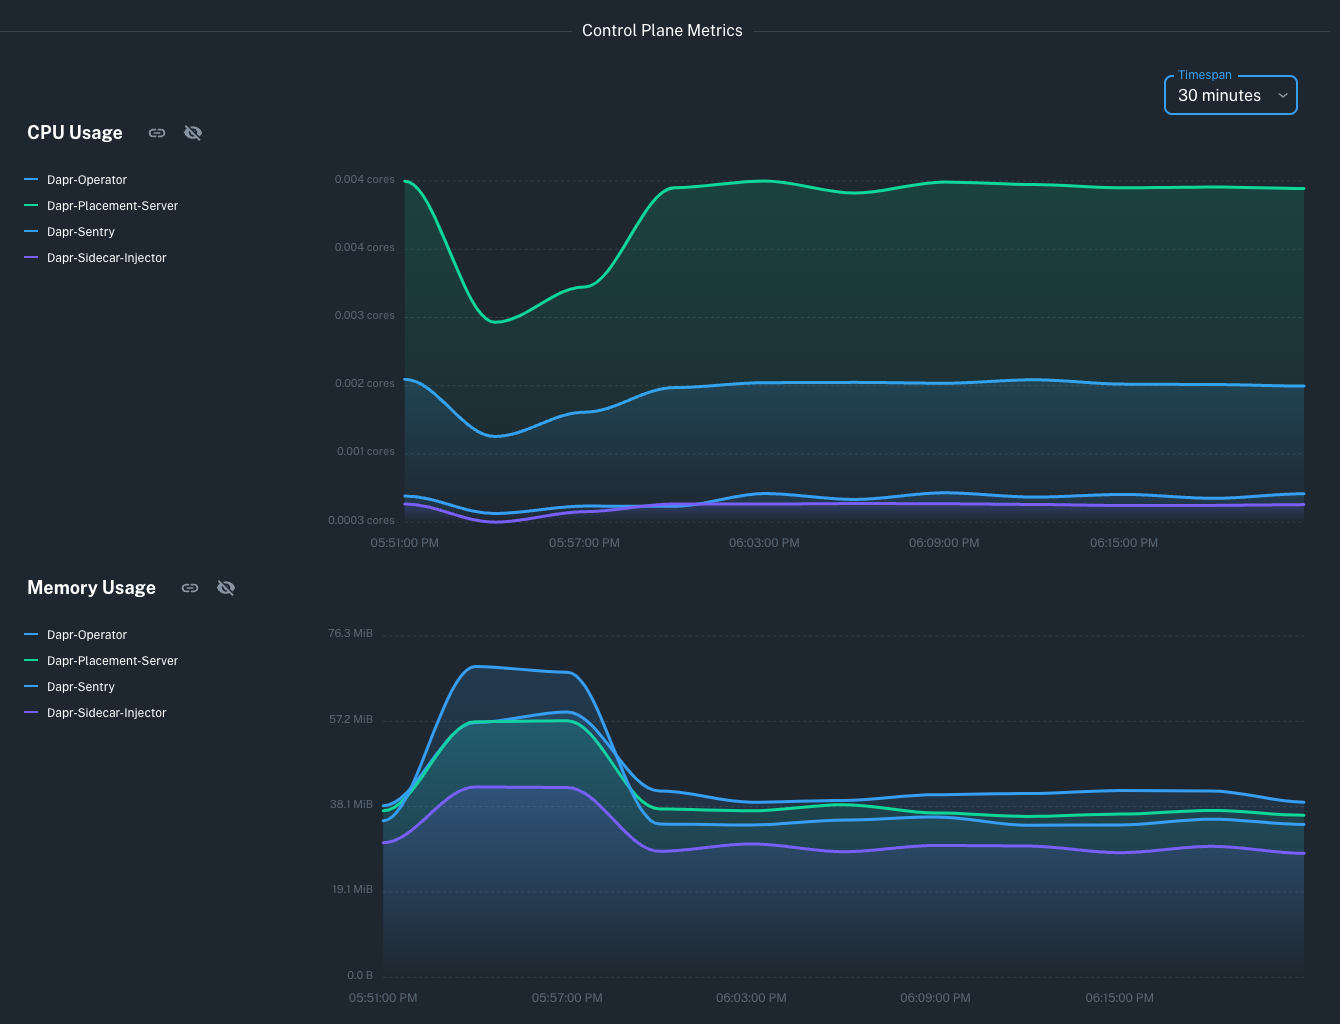
In addition to pod details, control plane metrics are also captured to provide further insights into potential metrics issues.
Critical metrics issues for the control plane are covered by default notification rules, meaning any critical metrics error visible in the metrics graph will likely trigger a notification rule to fire.
Conductor Agent Health
The Conductor agent appears as either Online or Offline. To view status logs to determine the most recent actions performed by the agent, select the status indicator under agent health.
Dapr Application and Component Insights
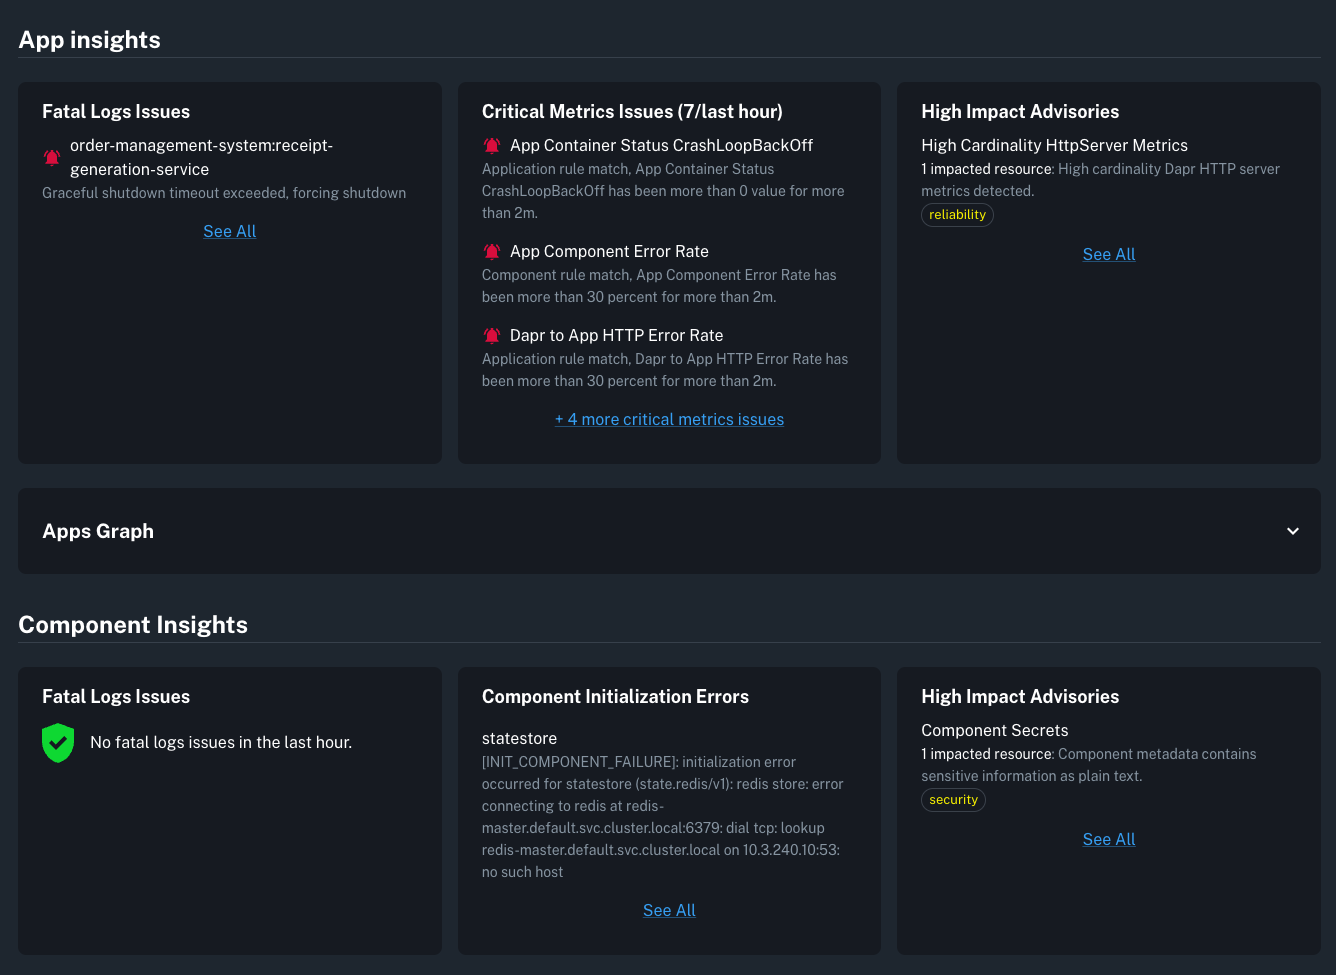
In addition to the cluster control plane insights and recommendations, Conductor aggregates data captured from the Dapr data plane and Dapr-enabled workloads in the cluster to provide a more holistic view of overall cluster health. These insights include:
- Fatal logs issues, critical metrics issues, and high-impact advisories across all cluster applications
- Fatal logs issues, initialization errors, and high-impact advisories across all cluster components
Apps Graph
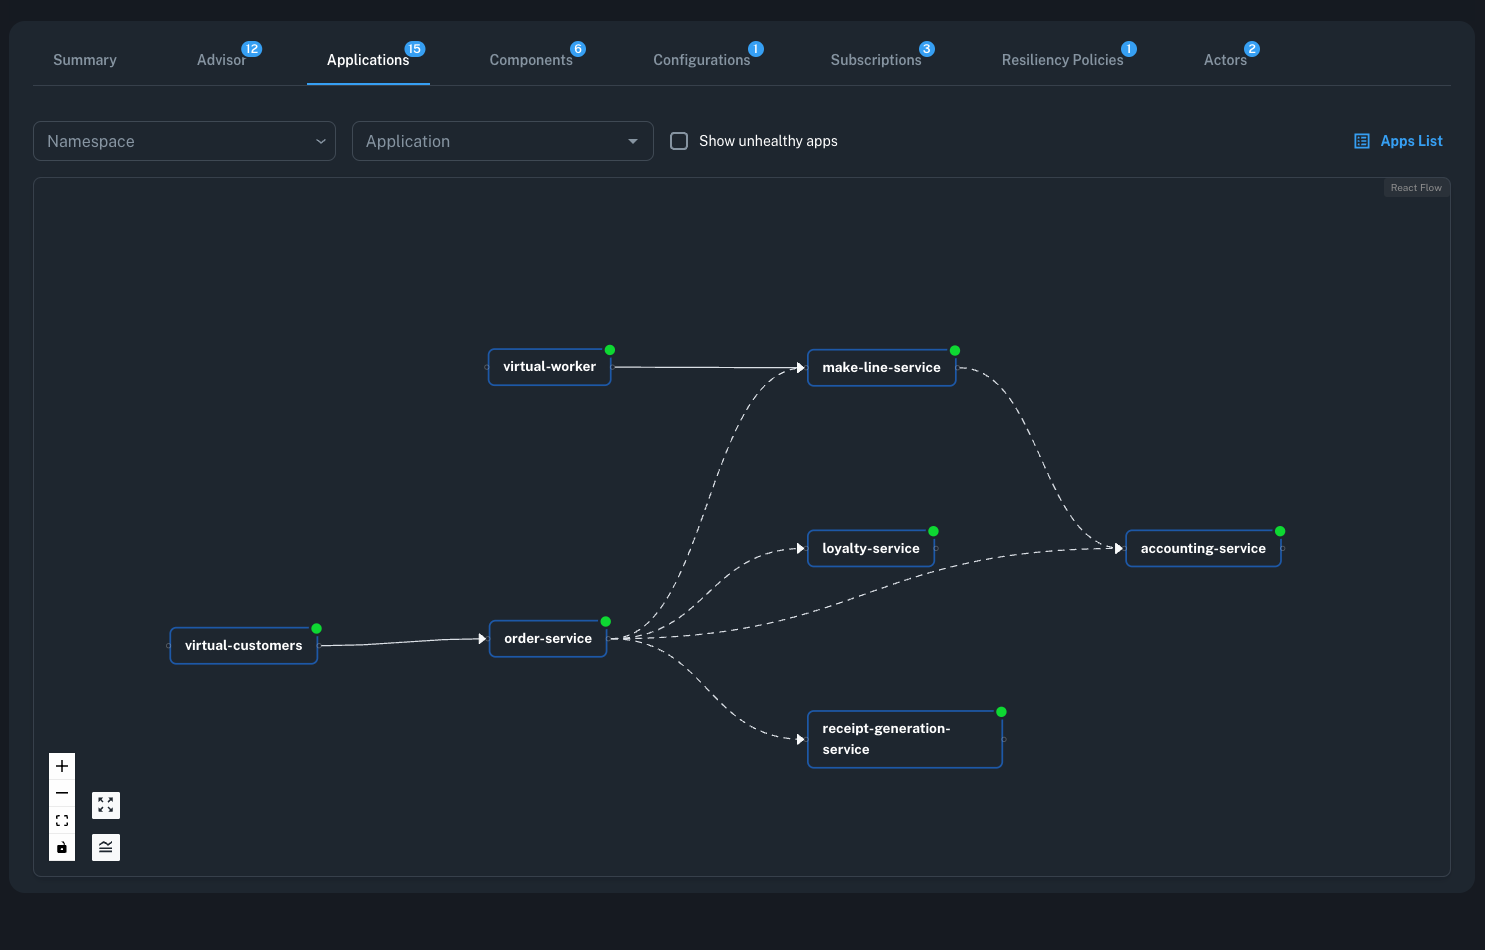
The dashboard also includes an embedded view of the Apps Graph. The Apps Graph displays applications as individual nodes which may be interconnected via Dapr service invocation and pub/sub API calls. Individual application nodes and components can be isolated to provide additional context and data including potential metrics issues. For more details, see application visualization.
Cluster Inventory
Within the context of a single cluster, visibility is provided across all Dapr resources including:
- Dapr-enabled applications
- Components
- Configurations
- Subscriptions
- Resiliency Policies
- Actors
Applications
When inspecting a cluster, you can take a deeper look at the applications deployed across all namespaces. If an application insights status appears as Issues Detected, the cluster dashboard will likely have either critical logs issues, critical metrics issues, or high advisories which have not been addressed in the App Insights section.
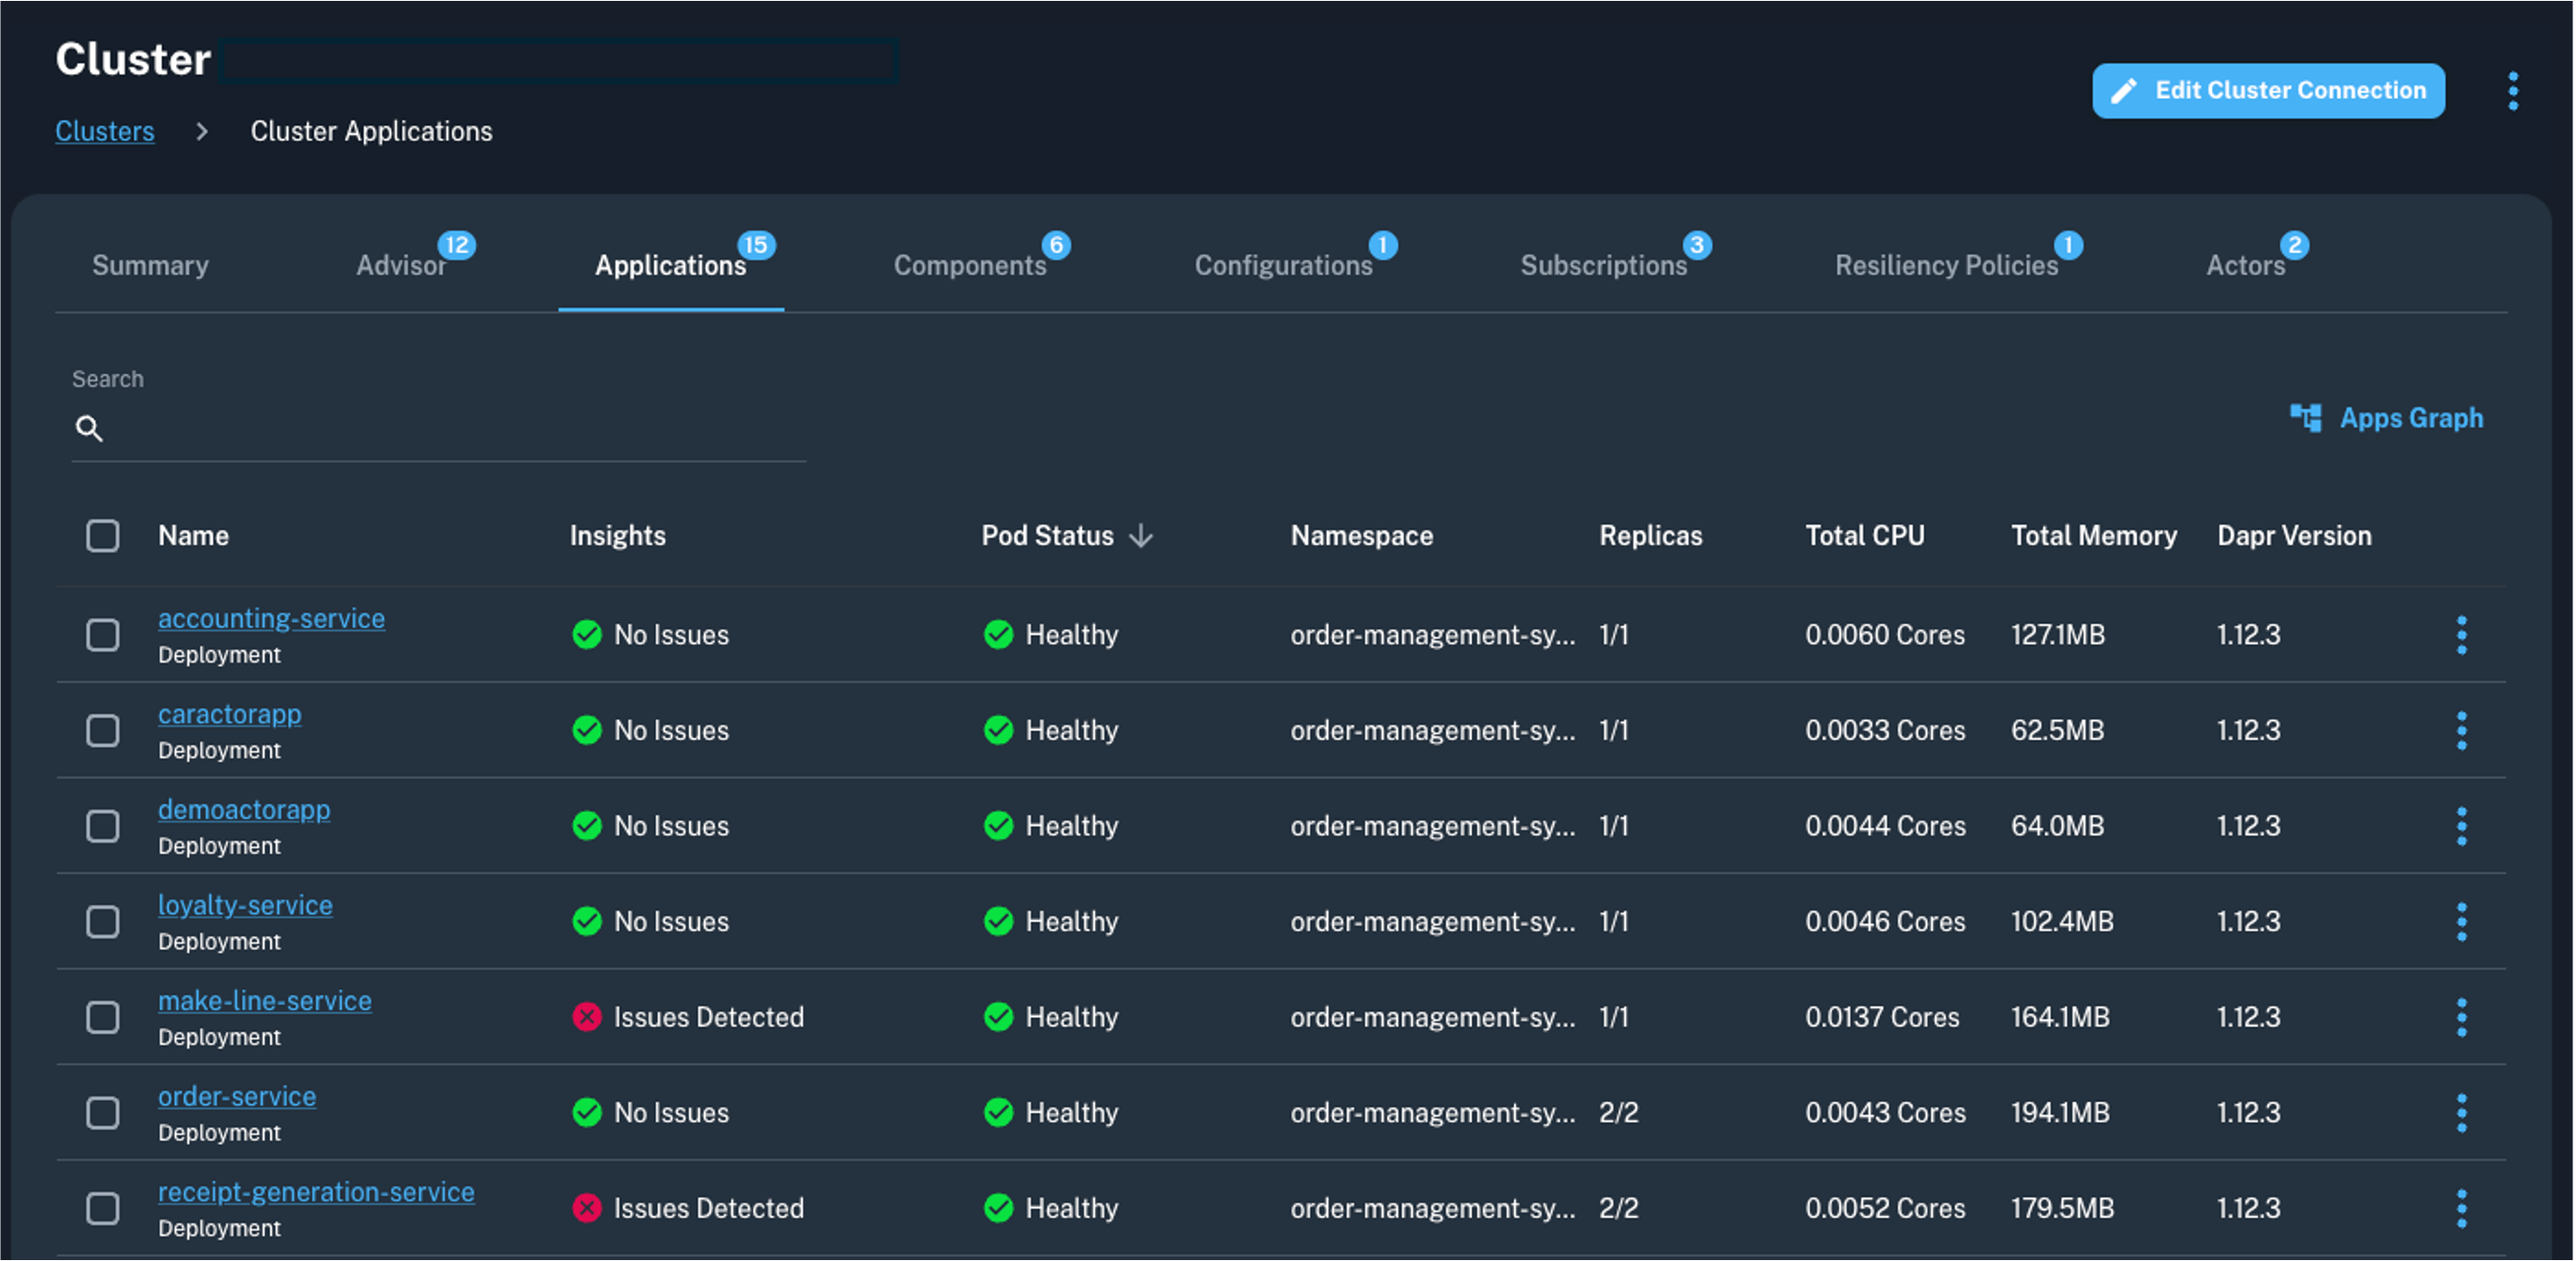
In addition to viewing insights across all applications, you can also view data around current CPU and memory utilization of the pod, as well as the Dapr version of the injected sidecar. At a glance, the resource usage data can provide an easy way to identify the most resource-intensive applications in the cluster.
Upgrading the Dapr control plane version does not automatically upgrade all Dapr sidecars to ensure they are using the newest version. To rollout applications after an upgrade has taken place, you can choose to rollout an individual application, select a subset of applications to rollout, or you can rollout all applications via the top-level action menu on the applications tab in the console.
To dive into application insights in more detail, visit applications.
Components
Dapr components connect applications to underlying infrastructure via the Dapr APIs. For a detailed overview of components, go to Components.
Additional Resource Insights
Configurations
All Dapr configuration resources deployed to a cluster can be listed and viewed by navigating to the Configurations tab in the console. Configuration can be assigned to a Dapr-enabled pod via the dapr.io/config annotation. For insight into the various sidecar configuration settings supported by Dapr, see sidecar configuration settings.

Subscriptions
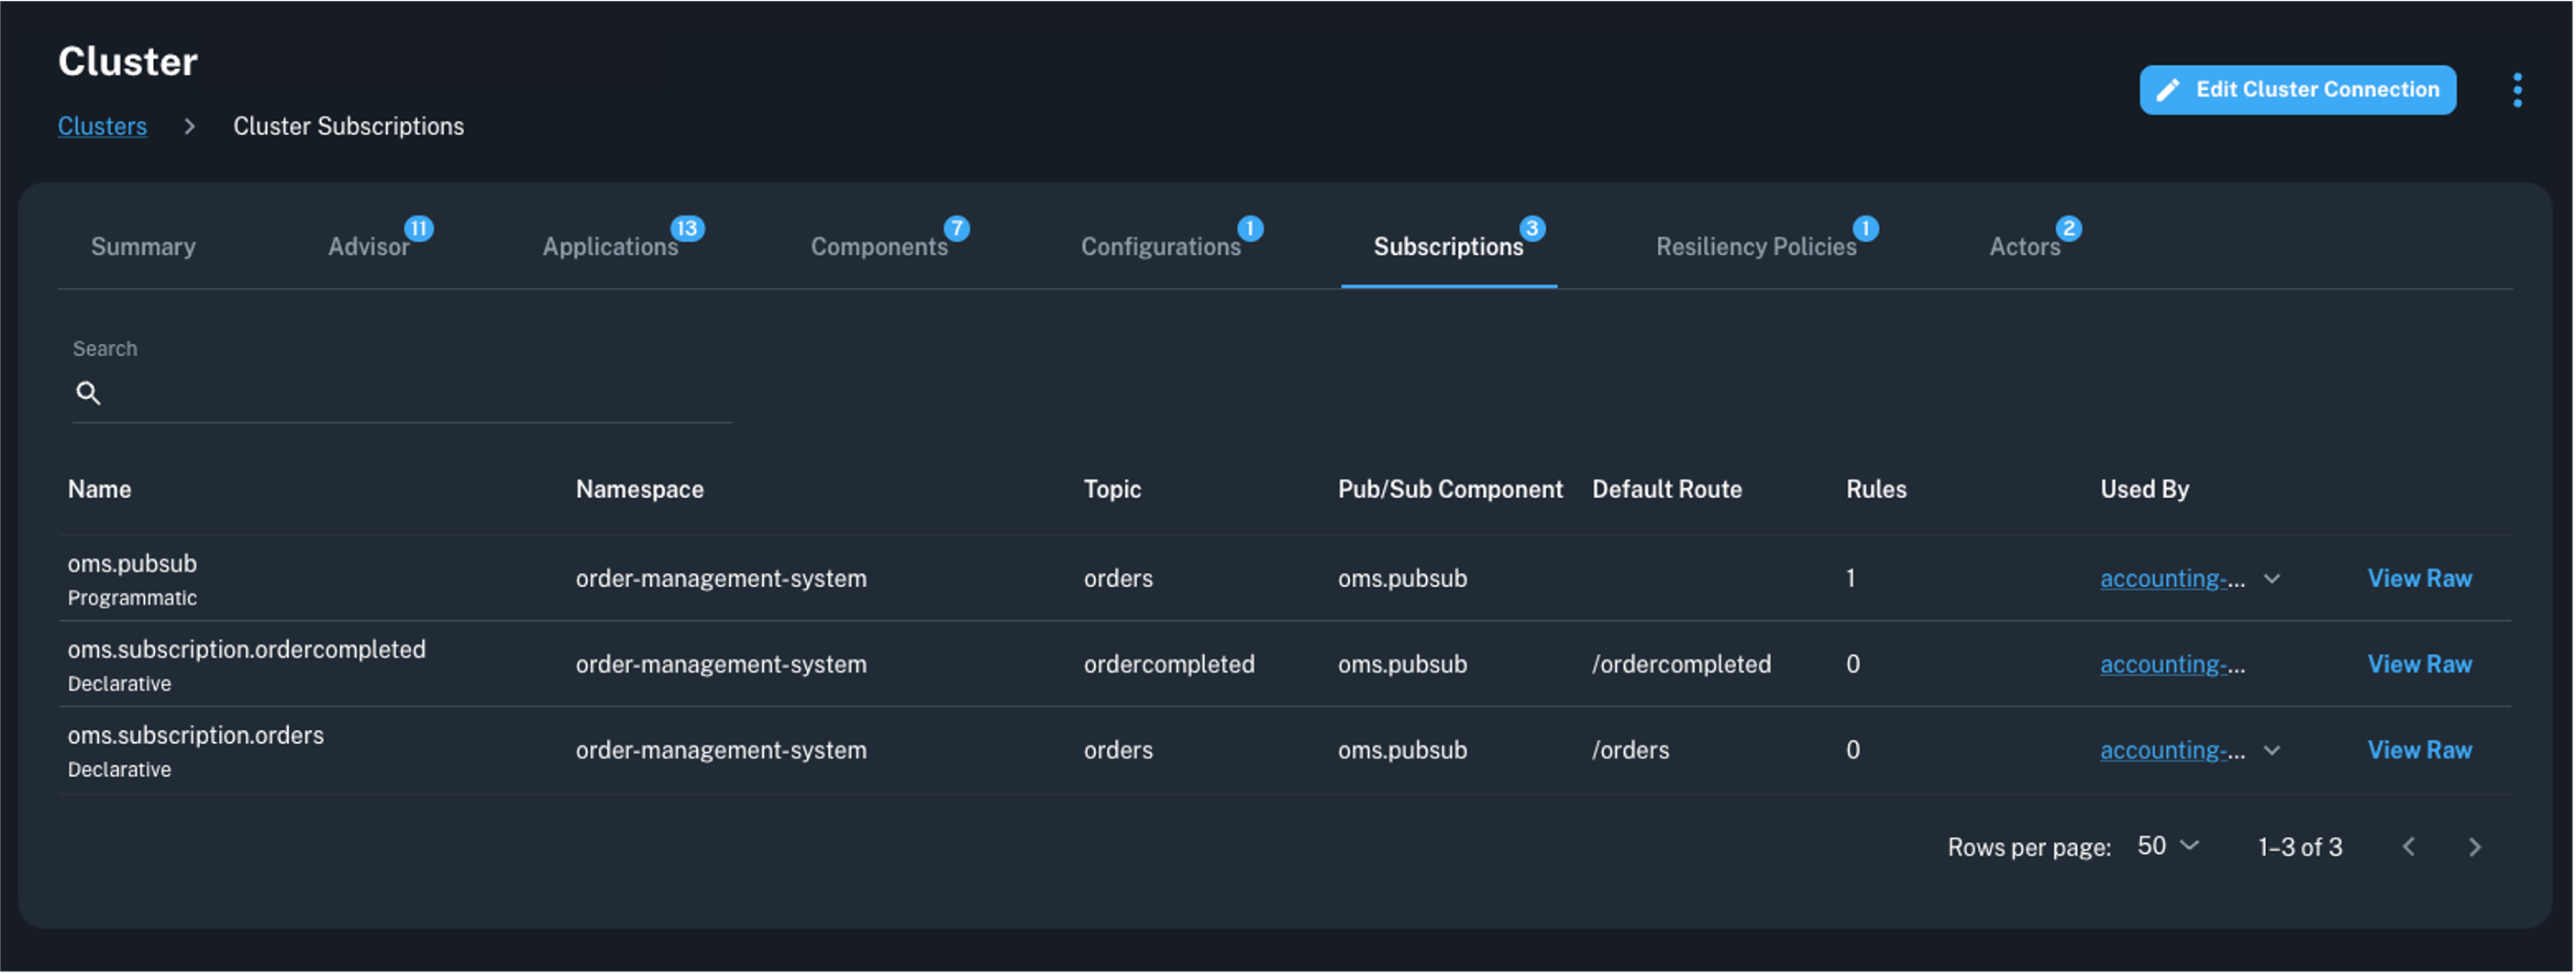
All Dapr subscription resources deployed to a cluster can be listed and viewed by navigating to the Subscriptions tab in the console. The cluster-level subscriptions view provides information about the types, topics, associated pub/sub components, and routing information for each subscription.
Resiliency Policies
All Dapr resiliency resources deployed to a cluster can be listed and viewed by navigating to the Resiliency Policies tab in the console.

Actors
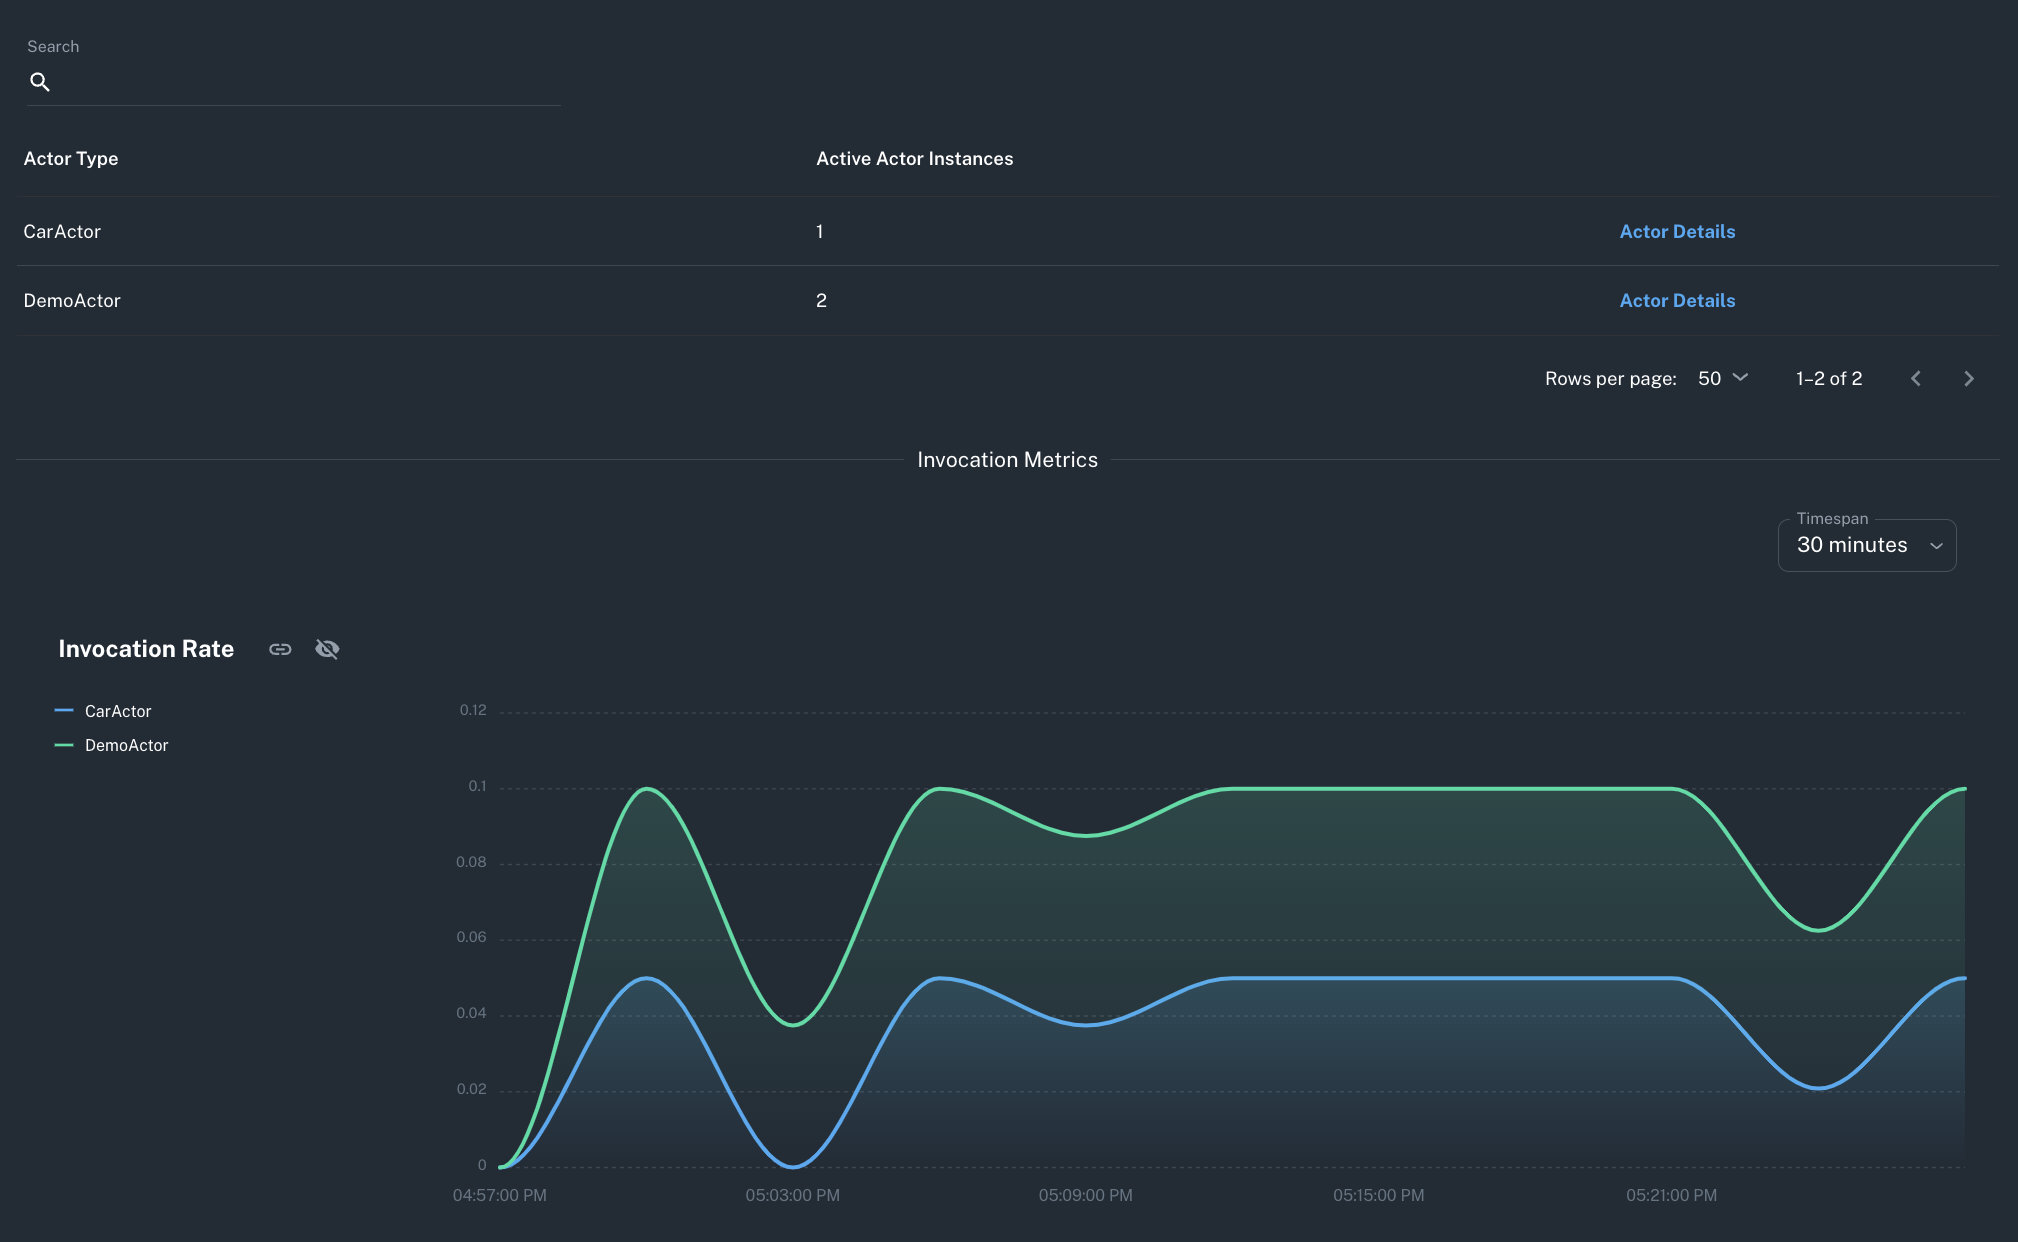
Dapr implements the virtual actor pattern, providing an approach to manage concurrency, fault tolerance and resource management of distributed apps. To make monitoring actors in a cluster easier for operators, Conductor provides:
- A consolidated view of the various Dapr actor types present in the cluster along with the active actor count
- Actor invocation metrics graphs to depict the frequency of direct actor calls, as indicated by the
Count of Completed Requestsmetric (dapr_http_client_completed_count). This metric originates from the Dapr HTTP client which is used by the Dapr SDK to facilitate actor communication. - Timer metrics graphs to depict the frequency at which an actor's timer is fired. It corresponds to the
Number of Actor Timers Fired Requests(dapr_runtime_actor_timers_fired_total) metric. - Reminders metrics graphs to depict the frequency at which an actor's reminder is fired. It corresponds to the
Number of Actor Reminders Fired Requests(dapr_runtime_actor_reminders_fired_total) metric.
The data points on the actor metrics graphs reflect the average per-second rate over the past five minutes.
