Apps Graph
The Apps Graph provides a comprehensive, interactive visualization of Dapr-enabled applications, showing their connections with other applications and infrastructure components in a cluster. The Apps Graph integrates Dapr and Kubernetes configuration data with near real-time network telemetry, transforming raw telemetry data, alerts, and logs from multiple sources into a visual graph format, helping operators monitor application health, pinpoint bottlenecks, and diagnose issues across the distributed architecture.
It is a useful tool for both Platform and Developer teams alike, offering the following features:
-
Topology visualization: Designed for Dapr-enabled applications, the Apps Graph accurately depicts application connectivity and health across the entire cluster, reflecting the real-time status and network behavior of applications and infrastructure resources.
-
Rapid issue detection: The graph enables quick filtering to highlight applications affected by outages or performance issues, allowing operators to focus on critical areas.
-
Interactive exploration: Users can drill down into individual nodes, such as a specific app (e.g., "order-service") or Dapr component (e.g., a message broker), to zoom in and view detailed network metrics, health indicators, and notifications relevant to that node.
Viewing Modes
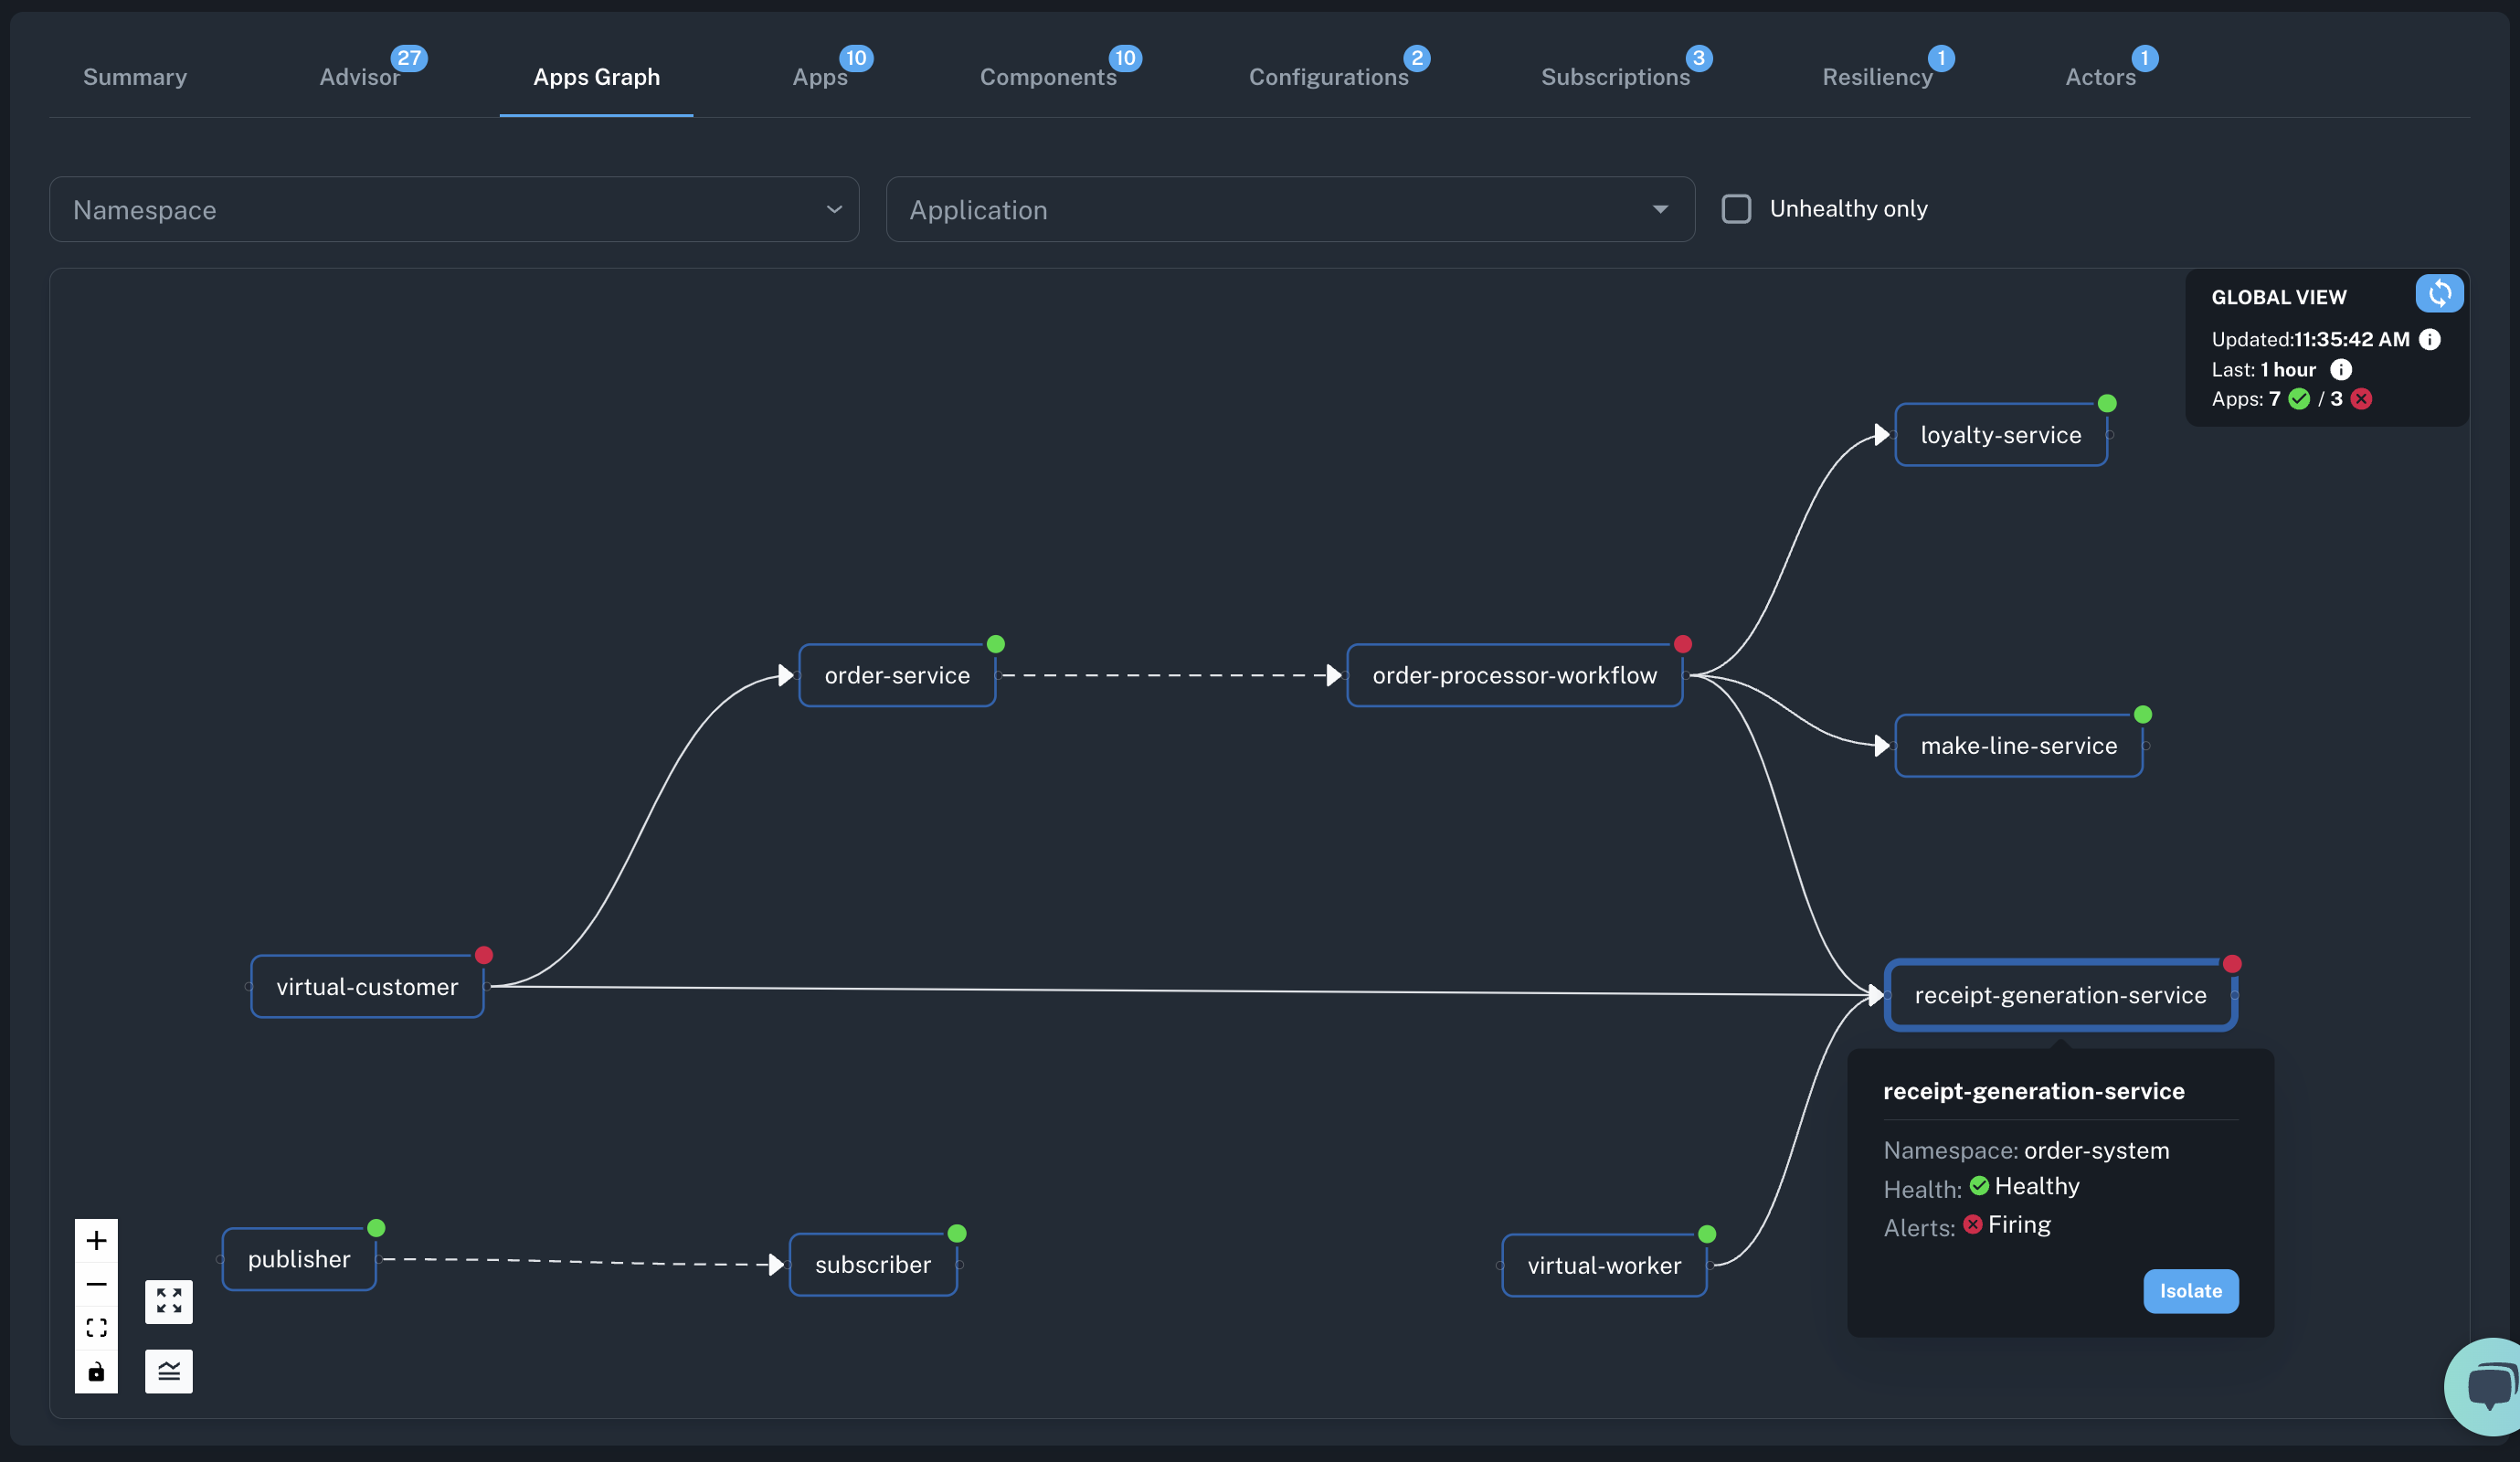
- Global view: Displays a high-level topology of all applications, showing overall health and communication dependencies within the cluster.
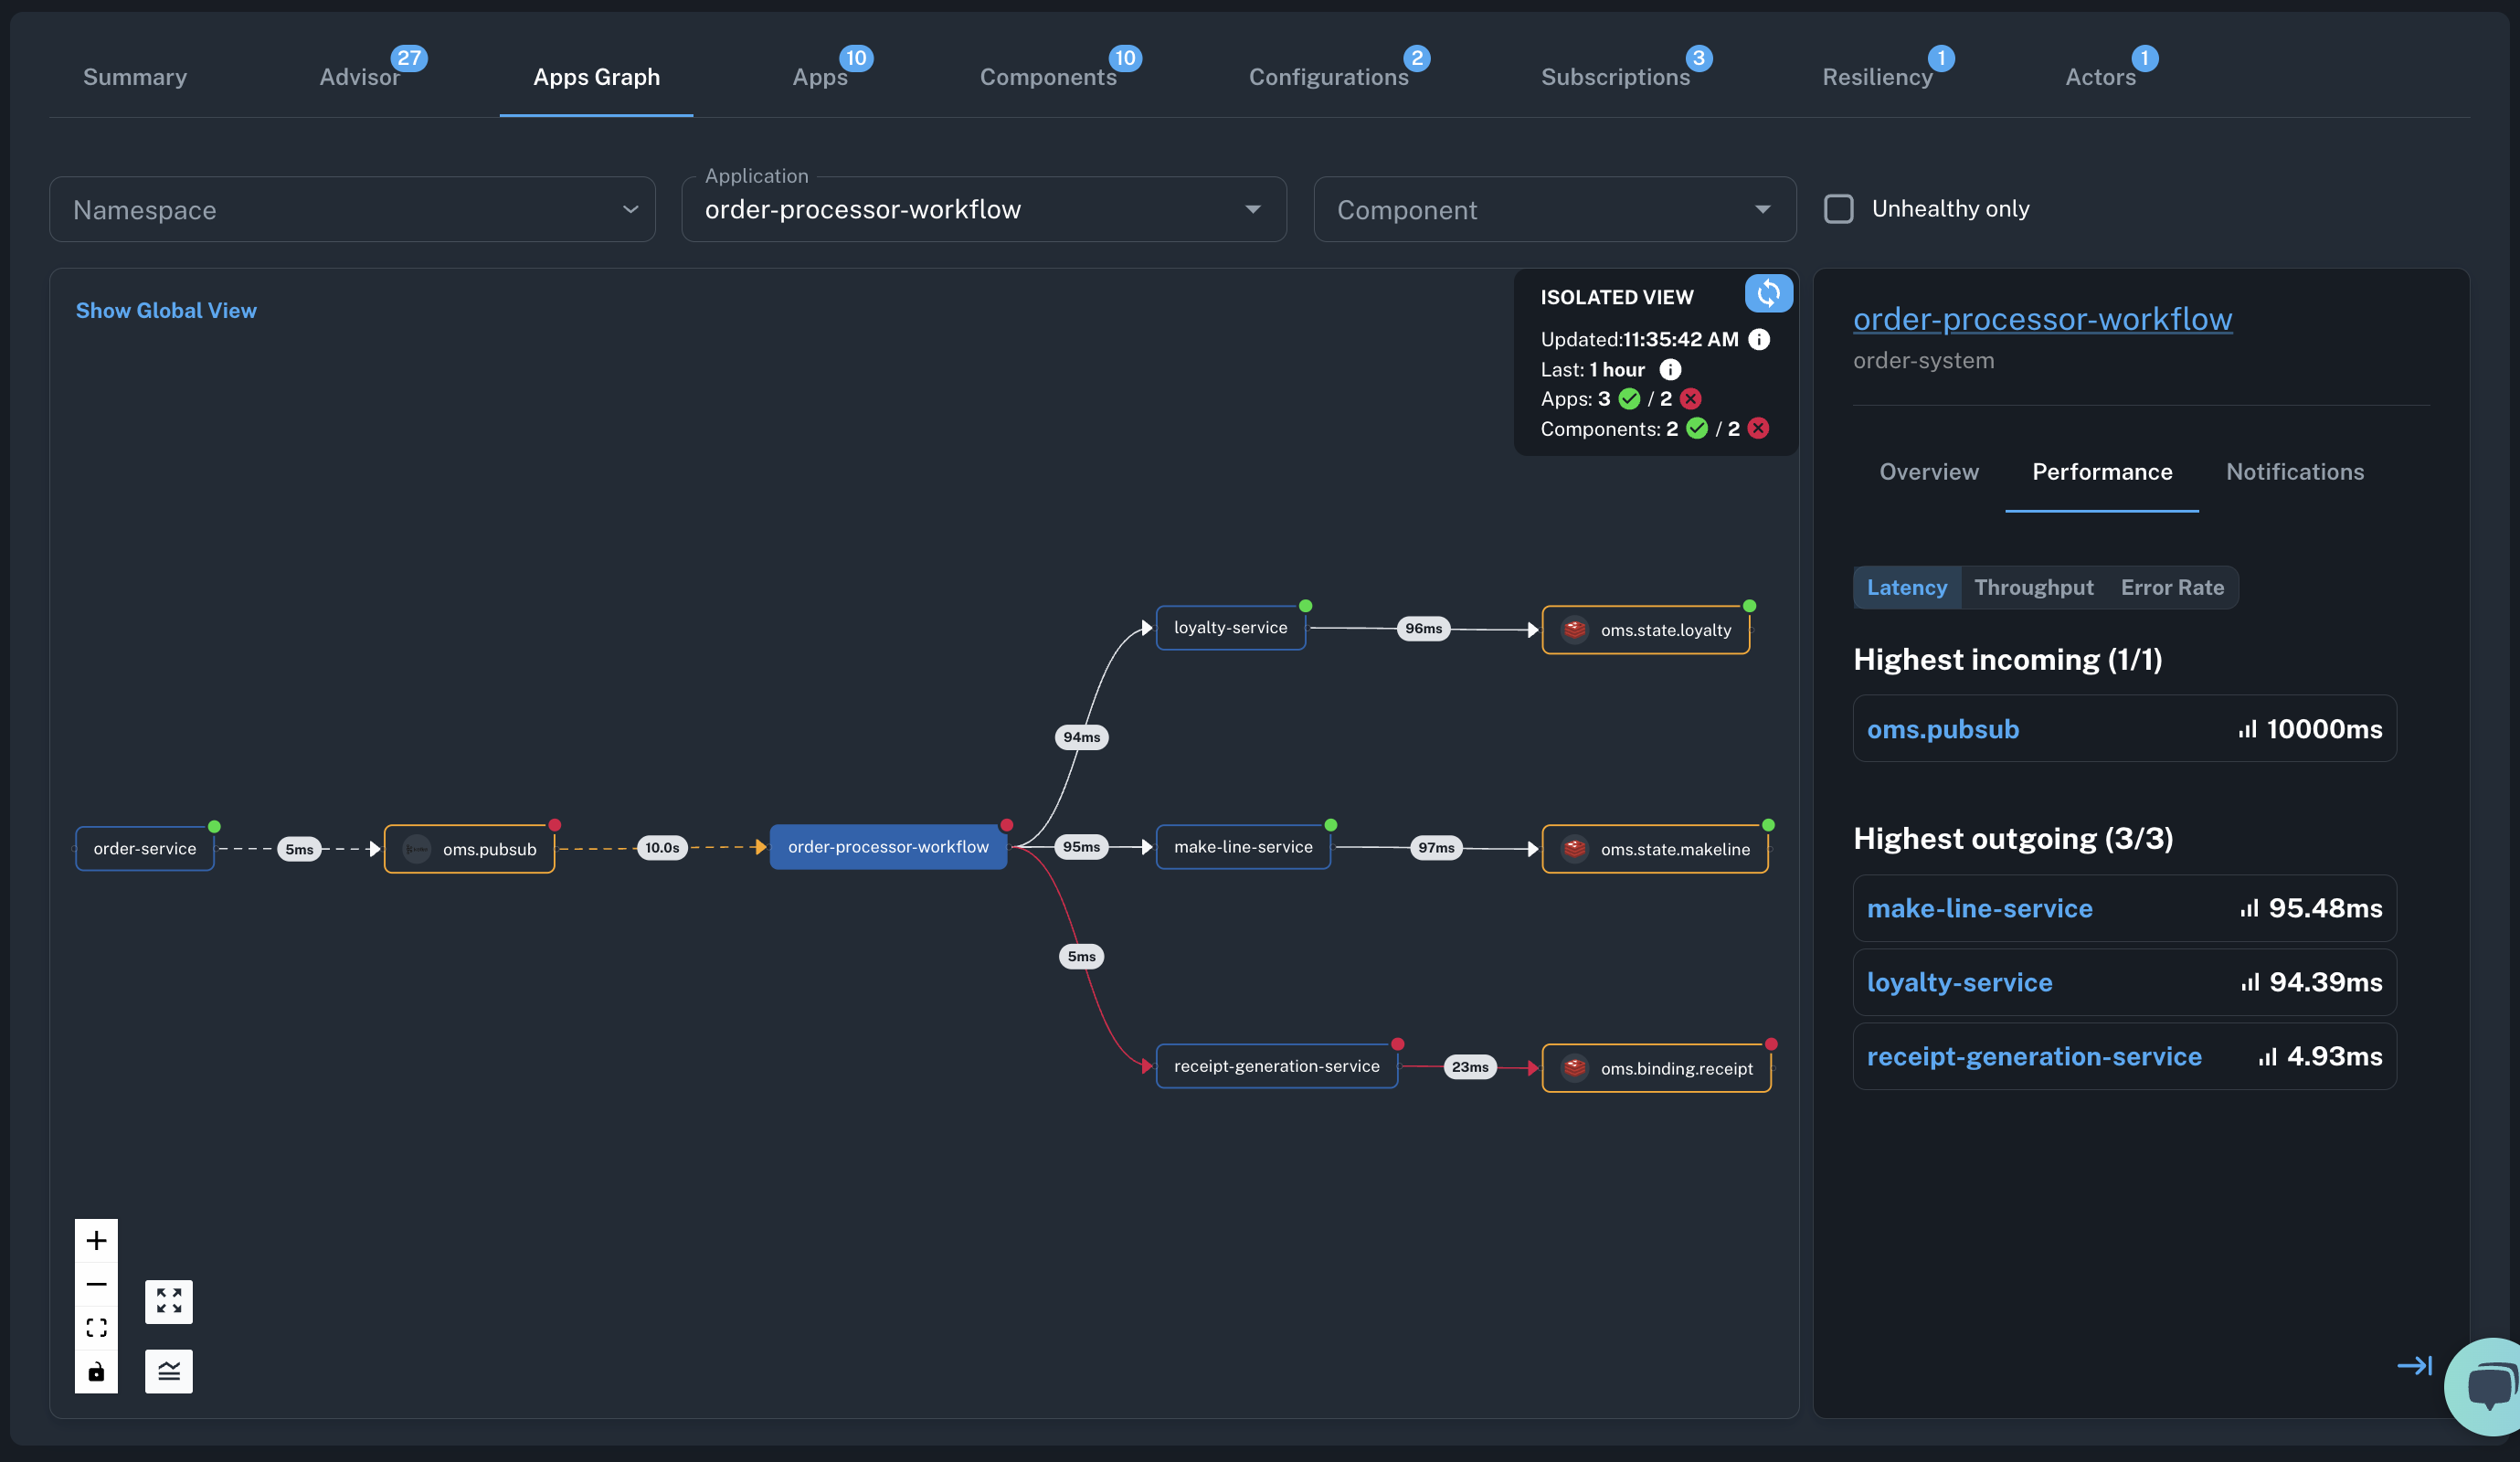
- Isolated view: Focuses on a single application and its immediate neighboring applications, including related infrastructure components, providing detailed insights into metrics, performance, errors, and notifications.
Global View
The global view offers a birds-eye view of all applications running within a selected cluster or namespace. This view enables users to understand the overall connectivity between applications, identify service dependencies, and assess application health across the entire environment.

Key Features
- Filtering: Filter the graph by Kubernetes namespace, application name, or application health status to focus on specific areas.
- Context panel: Provides a quick summary of essential information about the graph view type (
GlobalorIsolated) including the timing details (e.g., when the graph was last refreshed and the duration of the time window it represents) and node statistics (number of healthy and unhealthy apps/components). - Application nodes: Each application is represented as a node labeled with the application name and health status, making it easy to assess overall cluster health.
- Connection lines: Lines between nodes illustrate communication patterns (solid line for service invocation, and dashed for pub/sub interactions), highlighting dependencies between applications.
- Application health indicator: A health indicator combining pod health and firing critical metrics alerts:
- Health (in tooltip): Status of application pods (Green: Healthy, Red: Not running, Yellow: Degraded, Gray: Unknown).
- Alerts (in tooltip): Reflects active critical alerts for app or associated components (Red: Alert firing, Green: None).
- Possible combinations:
- Green + Green = Green (No issues)
- Green + Gray = Yellow (Degraded)
- Green + Yellow = Yellow (Degraded)
- Green + Red = Red (Issues detected)
Isolated View
The isolated view scopes the Apps Graph to a single application, allowing users to investigate detailed runtime metrics, network performance, and notifications specific to that application and its infrastructure dependencies. This view is ideal for troubleshooting and in-depth analysis of an application's interactions, dependencies, and performance.

Key Features
In addition to the details available in the global view, the isolated view includes the following:
- Component nodes: Shows the selected application and its direct infrastructure dependencies, including related components as nodes.
- Component node health: Indicates health status based on component initialization checks and any firing critical metrics alerts.
- Init status (in tooltip): Status of component initialization check (Green: Initialized, Red: Error, Gray: Unknown).
- Alerts (in tooltip): Reflects active critical alerts (Red: Alert firing, Green: None).
- Possible combinations:
- Green + Green = Green (No issues)
- Green + Gray = Yellow (Degraded)
- Green + Red = Red (Issues detected)
- Edges: Communication channels between nodes display call latency details.
- Red: Indicates a non-zero error rate on the connection.
- Yellow: Indicates latency above one second, signaling potential delays.
- Network metrics: Hovering over an edge displays average metrics for the associated time period (1 hour).
- Error rate: Percentage of requests with errors.
- Latency: P95 latency in milliseconds.
- Requests per second (RPS): Traffic throughput.
- Details panel (right-hand side): Shows information for the selected application or component node:
- Overview: Displays pod status, pod uptime, container restarts, component counts, and any active high-impact advisories or critical metrics alerts.
- Performance: Lists incoming and outgoing requests, sorted by highest latency, throughput and error rate metrics.
- Notifications: Shows unresolved critical alerts and fatal log notifications from the selected node.
Use Cases
Take advantage of the Apps Graph for the following developer and operations scenarios:
-
Inspect application topology: Understand the topology of apps deployed on the cluster and their dependencies, along with infrastructure components and relationships within the environment. This is useful for onboarding new team members who need to familiarize themselves with the production topology or when explaining the application topology to stakeholders, facilitating better collaboration and shared understanding across teams.
-
Analyze traffic patterns: Examine traffic volume, latency, and error rates for incoming and outgoing requests to identify and diagnose performance issues. This helps in pinpointing bottlenecks, slow pub/sub consumers, and service calls that may be degrading app performance or impacting reliability.
-
Troubleshoot unhealthy applications: Drill down into individual applications to identify and resolve specific issues highlighted by alerts and log entries. It is also valuable for identifying issues in the underlying infrastructure and understanding how these issues impact downstream services and dependencies, enabling teams to address problems holistically.